Key Resistance Levels: 1.0800, 1.0900, 1.1000
Key Support Levels: 1.0600, 1.0500, 1.0400

EUR/CHF Price Long-term Trend: Ranging
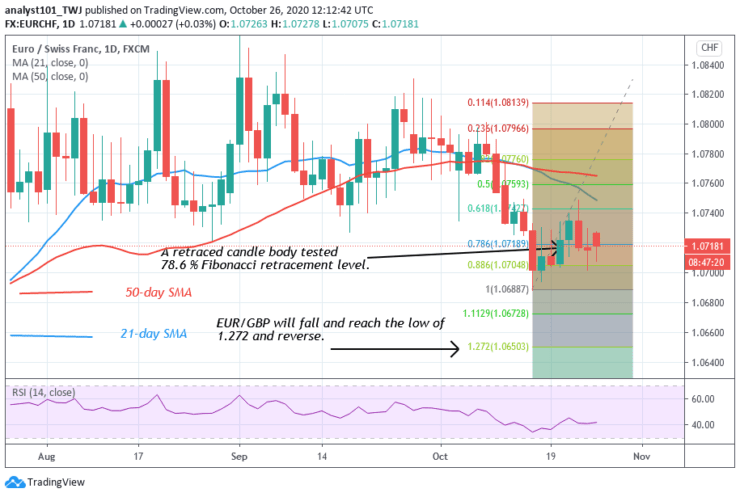
EUR/CHF has been on a downward move since September 25. On October 15 downtrend; a retraced candle body tested 78.6 % Fibonacci retracement level. This indicates that the pair will fall and reach a low of 1.272 and later reverse.
Daily Chart Indicators Reading:
The pair is at level 41 of the Relative Strength Index period 14. It implies that the market is in a downtrend and below the centerline 50. The 50-day SMA and 21-day SMA are sloping horizontally. It indicates the sideways trend.
EUR/CHF Medium-term Trend: Bullish
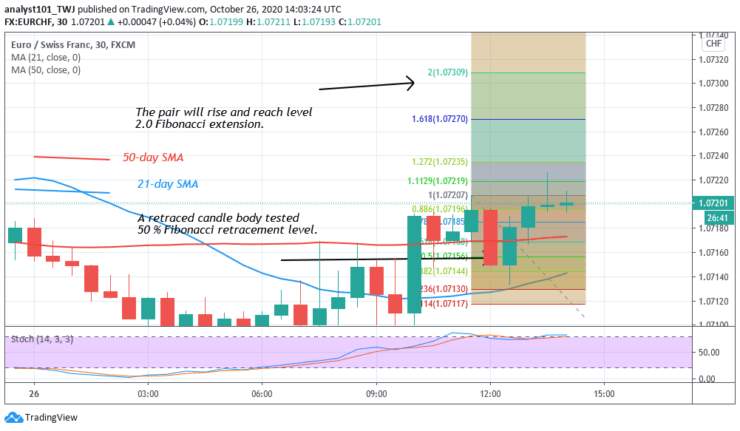
On the 4-hour chart, the pair is also rising. On October 20, a retraced candle body tested 50 Fibonacci retracement level. This also indicates that the pair will rise and reach level 2.0 Fibonacci extension. That is the low level of 1.0730.
4 Hour Chart Indicator Reading
The 50-day and 21-day SMAs are sloping sideways indicating the previous trend. The pair is below the 30% range of the daily stochastic. It indicates that the market is in a bearish momentum.
General Outlook for EUR/CHF
EUR/CHF is rising after breaking the initial resistance. The price rebounded at level 1.0714 to resume the upward move. According to the Fibonacci tool, the market will reach level of 1.0730.
Source: https://learn2.trade


 Hot Features


