XRP/USD MARKET NOVEMBER 26

After the price retracement, it may resume its bullish trend and the resistance level of $0.79 and $0.88 may be reached. Below the current price, the level is found the support levels at $0.55, $0.44, and $0.39. However, the relative strength index period 14 is at 70 levels bending down to indicate a sell signal which may be a pullback.
KEY LEVELS:
Resistance levels: $0.72, $0.79, $0.88
Support levels: $0.61, $0.55, $0.49
XRP/USD Long-term Trend: Bullish
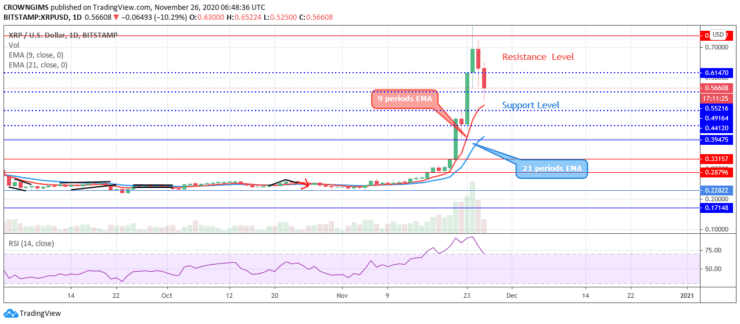
XRPUSD is bullish in the long-term outlook; the crypto soars towards the north by the strong bullish momentum. The bulls’ momentum breaks up the resistance levels of $0.28, $0.33, and $0.36. The price has tested the resistance level of $0.79 on October 24. The price pulls back to retest the broken level of $0.61. Today, the XRP market is dominated by the bears and the daily candle is bearish. The price may increase further after the pullback.

XRPUSD Daily chart, November 26
The two EMAs are located below the coin and it is trading far above 9 periods EMA and 21 periods EMA which indicate a strong bullish momentum. After the price retracement, it may resume its bullish trend and the resistance level of $0.79 and $0.88 may be reached. Below the current price, the support levels is found at $0.55, $0.44, and $0.39. However, the relative strength index period 14 is at 70 levels bending down to indicate a sell signal which may be a pullback.
XRP/USD medium-term Trend: Bullish
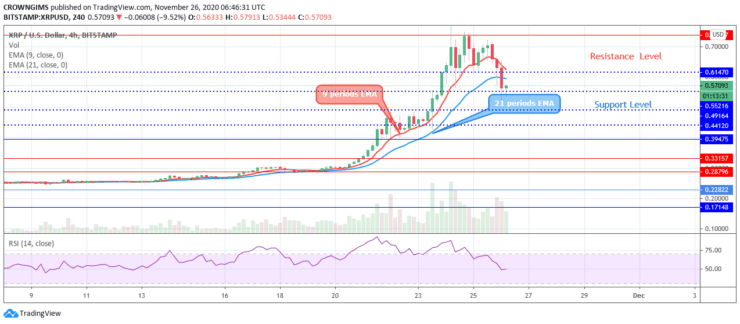
The bulls dominate the XRPUSD market. Immediately after the breakout from the consolidation zone, the bulls push the price high above the September high. It is currently pulling back at the resistance level of $0.72. The price is testing the support level of $0.55 at the time of writing this report. In case the just mentioned level does not hold, there will be a further price reduction.

The price has penetrated the two EMAs downside and it is trading below 9 periods EMA and 21 periods EMA. The fast-moving EMA is trying to cross the slow-moving EMA downside. The relative strength index period 14 is pointing down at 50 levels which connotes a sell signal and it may be a pullback.
Source: https://learn2.trade


 Hot Features


