ADVFN Logo ADVFN

We could not find any results for:
Make sure your spelling is correct or try broadening your search.

Trending Now

Toplists

It looks like you aren't logged in.
Click the button below to log in and view your recent history.

Hot Features

Registration Strip Icon for alerts Register for real-time alerts, custom portfolio, and market movers

Gold (XAUUSD) Recovers above Level $1,760 but Struggles to Break $1,800 High

Share On Facebook
share on Linkedin
Print

Key Resistance Levels: $1,900, $1,950, $2000
Key Support Levels: $1,750, $1, 700,$1,650

©

Gold (XAUUSD) Long-term Trend: Bullish
XAUUSD has resumed an upward move after falling to the low of level $1,760 on June 18. On June 29, the bears retested the support as Gold resumed upward. The implication is that the uptrend has resumed as price fails to break the current support the second time. From the Fibonacci tool, Gold has reached bearish exhaustion at the 2.618 Fibonacci extensions as price resumes upward.

XAUUSD – Daily Chart

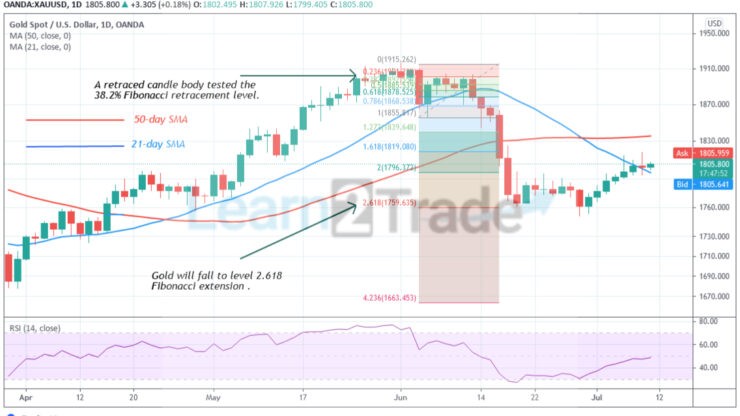
Daily Chart Indicators Reading:
Gold has risen to level 48 of the Relative Strength Index period 14. It indicates that Gold is in the downtrend zone and below the centerline 50. The 21-day SMA and 50-day SMA are sloping downward indicating the downtrend. The Gold price has broken above the 21-day SMA. A break above the 50-day SMA will propel Gold to rise.

Gold (XAUUSD) Medium-term bias: Bullish
On the 4 hour chart, the Gold price has resumed its upward move. Meanwhile, on July 6 uptrend, a retraced candle body tested the 78.6% Fibonacci retracement level. The retracement indicates that Gold will rise to level 1.272 Fibonacci extension and reverse. From the price action, the Gold price is rising to reach the Fibonacci level.

XAUUSD – 4 Hour Chart

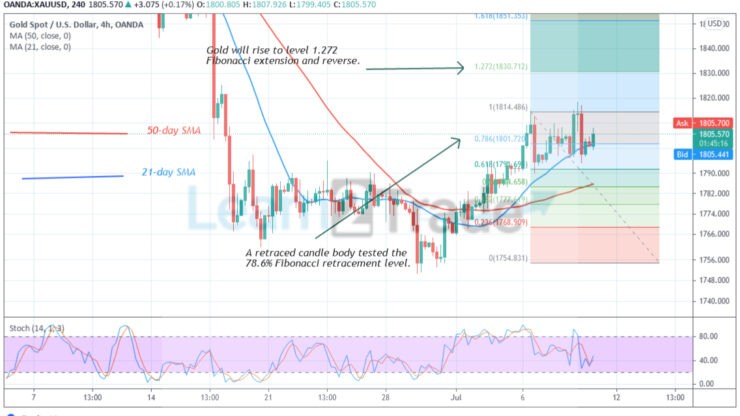
4-hour Chart Indicators Reading
Gold is above the 40% range of the daily stochastic. It indicates that the market has reached bullish momentum. The 21-day SMA and the 50-day SMA are sloping upward indicating the uptrend.

General Outlook for Gold (XAUUSD)
XAUUSD’s price has recovered above $1,760 support. Gold price is rising as the 21-day SMA crosses above the 50-day SMA. According to the Fibonacci tool, Gold will rise to level 1.272 Fibonacci extension and reverse. That is at level $1,830.71.


Source: https://learn2.trade

CLICK HERE TO REGISTER FOR FREE ON ADVFN, the world's leading stocks and shares information website, provides the private investor with all the latest high-tech trading tools and includes live price data streaming, stock quotes and the option to access 'Level 2' data on all of the world's key exchanges (LSE, NYSE, NASDAQ, Euronext etc).

This area of the ADVFN.com site is for independent financial commentary. These blogs are provided by independent authors via a common carrier platform and do not represent the opinions of ADVFN Plc. ADVFN Plc does not monitor, approve, endorse or exert editorial control over these articles and does not therefore accept responsibility for or make any warranties in connection with or recommend that you or any third party rely on such information. The information available at ADVFN.com is for your general information and use and is not intended to address your particular requirements. In particular, the information does not constitute any form of advice or recommendation by ADVFN.COM and is not intended to be relied upon by users in making (or refraining from making) any investment decisions. Authors may or may not have positions in stocks that they are discussing but it should be considered very likely that their opinions are aligned with their trading and that they hold positions in companies, forex, commodities and other instruments they discuss.

Leave A Reply

 
Do you want to write for our Newspaper? Get in touch: newspaper@advfn.com