Hot Features

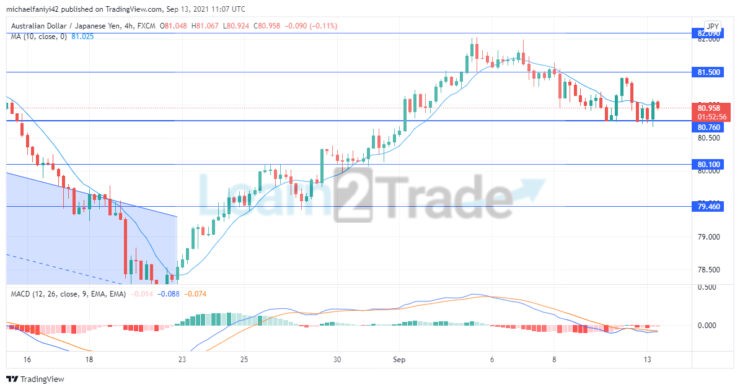
AUDJPY faces the 80.760 key level as it slips downward. The market began an uptrend after price beat a retreat at the 78.200 support level. The market kept climbing upward till it reached 82.090, at which point the market was knocked down. On its way downward, however, AUDJPY now faces the 80.760 key level which is preventing it from falling further.

AUDJPY Price Analysis – September 13
AUDJPY Important Zones
Resistance Zones: 81.500, 82.090, 82.900
Support Zones: 78.200, 79.460, 80.760
 AUDJPY Long Term Trend: Bearish
The AUDJPY market for the past 3 months can generally be described as bearish. This is because, since the 16th of June 2021, price has been falling. Bears faced a confrontation in the fall, majorly at 82.900 and then at 80.760. However, when the market fell to 79.200 on the 19th of August, the downtrend was reversed and price began a fresh uptrend. The market grew 5.27% to reach 82.090, where AUDJPY met brutal resistance and started plunging again.
AUDJPY now faces the 80.760 key level again. The last time the price fell to this level, it took about 20 days to recover. The MA period 10 (Moving Average) has shifted to the top of the latest daily candle to push it further down. The Moving Average Convergence Divergence (MACD) is showing decreasing bullish histogram bars and its lines are converging towards the zero level. These emphasize the weight of bearish pressure in the market. But the 80.760 level will fancy its chances of keeping price up.
 AUDJPY Short Term Trend: Ranging
AUDJPY 4-hour timeframe reveals that price has begun a ranging pattern below the 81.500 key level as 80.760 has been defending price. The MA period 10 remains above the 4-hours candlesticks, which is a sign of continuous market depression. The MACD Histogram has been all bearish since the 6th of September. Moreso, its lines are about to cross beneath the zero level. This shows that there is a tendency for the market to break lower from the 80.760 key level. When this happens, the price will fall to 80.100.
Source: https://learn2.trade