

 Hot Features

Key Highlights

Ethereum ETH) Current Statistics
The current price: $2,908.05
Market Capitalization: $341,770,388,786
Trading Volume: $28,141,190,537
Major supply zones: $3,000, $3,500, $4,000
Major demand zones: $2,500, $2,000, $1,500
Ethereum (ETH) Price Analysis September 22, 2021
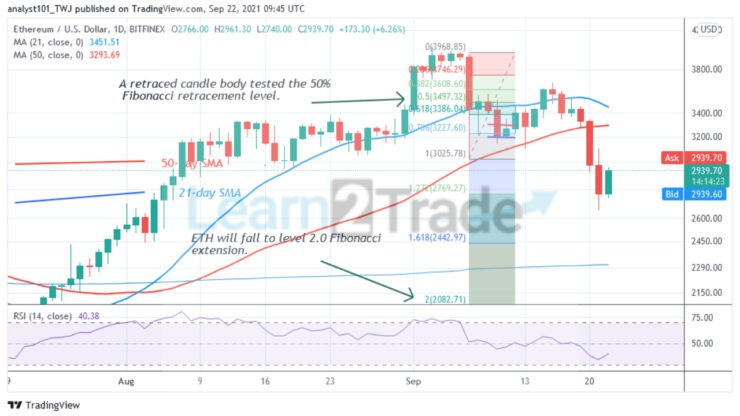
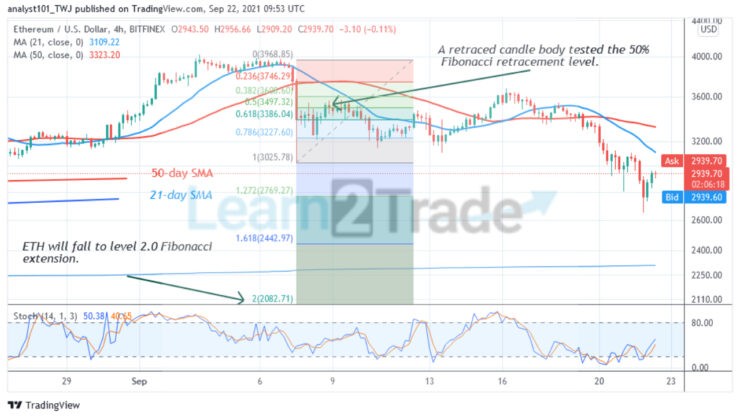
Ethereum’s (ETH) price has fallen below the moving averages suggesting a further downward movement of the crypto. The bears have also broken below the previous low at $3,026 to another low of $2,656. As the biggest altcoin falls below the previous low, further downsides are likely. Meanwhile, on September 7 downtrend; a retraced candle body tested the 50 % Fibonacci retracement level. The retracement indicates that Ether will fall to level 2.0 Fibonacci extension or level $2,082.71.
ETH Technical Indicators Reading
The crypto’s price is now below the moving averages which suggest that Ether is in the bearish trend zone. The altcoin is capable of falling in the bearish trend zone. Ether is at level 40 of the Relative Strength index period 14. It indicates that the altcoin is in the downtrend zone and below the centerline 50. The coin is above the 20% range of the daily stochastic. It indicates that the market is in the bullish trend zone.
Conclusion
Ethereum is likely to further decline as price breaks below the previous low at level $3,026. Nevertheless, the Fibonacci tool has further indicated a downward move to level 2.0 Fibonacci extension.
Source: https://learn2.trade


