ADVFN Logo

We could not find any results for:
Make sure your spelling is correct or try broadening your search.

Trending Now

Toplists

It looks like you aren't logged in.
Click the button below to log in and view your recent history.

Hot Features

Registration Strip Icon for charts Register for streaming realtime charts, analysis tools, and prices.

Litecoin (LTC) Fluctuates Between $144 and $155 as Buyers Recoup to Resume Uptrend

Share On Facebook
share on Linkedin
Print

Key Highlights
LTC price resumes downward correction
Litecoin fluctuates between $144 and $155

©

Litecoin (LTC) Current Statistics
The current price: $148.18
Market Capitalization: $12,451,441,024
Trading Volume: $12,451,441,024
Major supply zones: $200, $220, $240
Major demand zones: $100, $80, $60

Litecoin (LTC) Price Analysis January 5, 2022
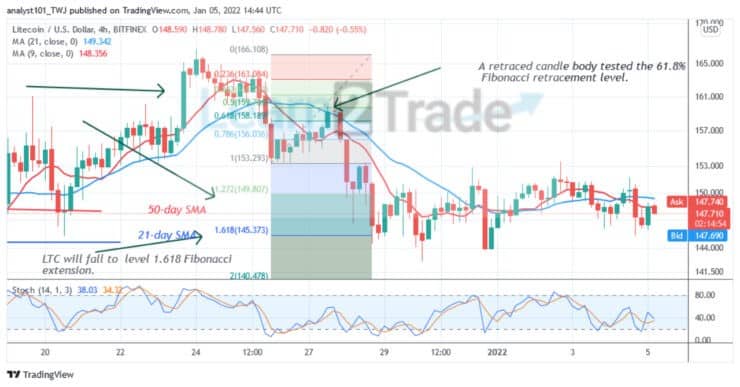
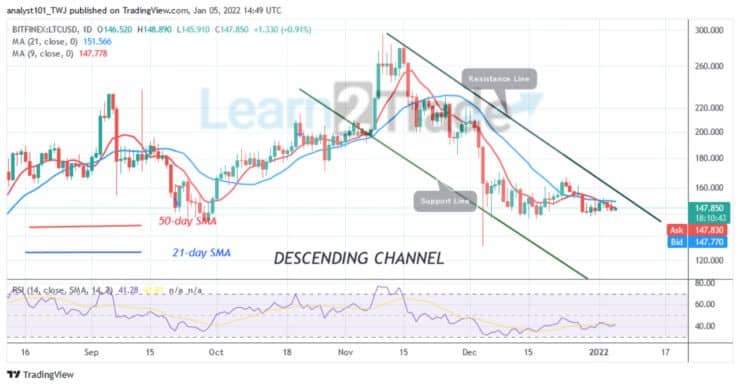
Litecoin’s (LTC) price is still in a downward correction as buyers recoup to resume uptrend. Since December 28, the cryptocurrency fell to the range-bound zone at the bottom of the chart. On December 23 uptrend, the altcoin corrected upward but was repelled at the $165 resistance level. Consequently, LTC/USD fell below the moving averages. Today, Litecoin is consolidating above $144 support but below $155 resistance. The uptrend will resume if the bulls break above the moving averages or $165high.

Litecoin (LTC) Fluctuates Between $144 and $155 as Buyers Recoup To Resume Uptrend
LTC/USD – Daily Chart

Litecoin (LTC) Technical Indicators Reading
LTC price is below the moving averages which indicate a possible fall of the cryptocurrency. The crypto has fallen to level 41 of the Relative Strength Index for period 14. The altcoin is in the downtrend zone and below the centerline 50. The market is above the 40% range of the daily stochastic. The bullish momentum is unstable as the price fluctuates.

Conclusion
Litecoin is in a range-bound move at the bottom of the chart as buyers recoup to resume uptrend. The price action is characterized by small body candlesticks called Doji and Spinning tops. The candlesticks are responsible for the current range-bound move. The candlesticks indicate that buyers and sellers are undecided about the direction of the market.

Litecoin (LTC) Fluctuates Between $144 and $155 as Buyers Recoup To Resume Uptrend
LTC/USD – 4 Hour ChartSource: https://learn2.trade

CLICK HERE TO REGISTER FOR FREE ON ADVFN, the world's leading stocks and shares information website, provides the private investor with all the latest high-tech trading tools and includes live price data streaming, stock quotes and the option to access 'Level 2' data on all of the world's key exchanges (LSE, NYSE, NASDAQ, Euronext etc).

This area of the ADVFN.com site is for independent financial commentary. These blogs are provided by independent authors via a common carrier platform and do not represent the opinions of ADVFN Plc. ADVFN Plc does not monitor, approve, endorse or exert editorial control over these articles and does not therefore accept responsibility for or make any warranties in connection with or recommend that you or any third party rely on such information. The information available at ADVFN.com is for your general information and use and is not intended to address your particular requirements. In particular, the information does not constitute any form of advice or recommendation by ADVFN.COM and is not intended to be relied upon by users in making (or refraining from making) any investment decisions. Authors may or may not have positions in stocks that they are discussing but it should be considered very likely that their opinions are aligned with their trading and that they hold positions in companies, forex, commodities and other instruments they discuss.

Leave A Reply

 
Do you want to write for our Newspaper? Get in touch: newspaper@advfn.com