

 Hot Features

Since the 15th of May, after the steep price crash, Ripple has been struggling; as its price action ranges sideways. Between the 10th to the 13th of June, we witnessed a slight, daily consecutive drop in price From $0.40857 to $0.31056.

SUPPORT LEVEL: $0.3328, $0.29560, $0.28164
RESISTANCE LEVELS: $0.41653, $0.45513, $0.44444
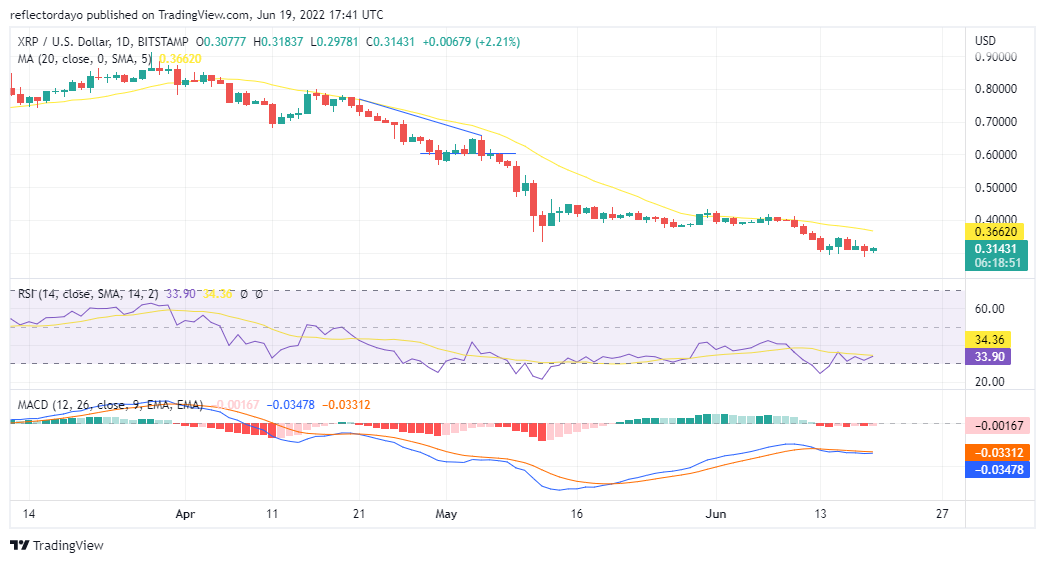
Readings From Indicators
The 9-day moving average curve and the price action range together; it is not above the curve and it is not below the curve. This particular market price behavior started on 17th May to the 10th of June, when XRPUSD dropped consecutively till the 13th. The Moving Average Convergence And Divergence indicator is showing a slight downtrend. The faster moving average curve and the slower moving average curve have now come closer to each other moving horizontally. This could indicate that the sideway movement might continue.
The Relative Strength Index indicator shows a strong downtrend movement of the market. On the 10th to 13th of June – the days of the slight price crash. Those days, the RSI indicator fell below the oversold region (below the 30% threshold) and bounced back to about 35%. This is still a strong downtrend.
Since the market has been ranging for almost a month now, the slight price drop might be a result of sentiments. The market may continue its ranging movement and be pegged at about $0.3131. A considerable amount of buyers are needed to be encouraged to invest in XRPUSD to raise its price.
Teach Yourself Technical Analysis: Technical Analysis


