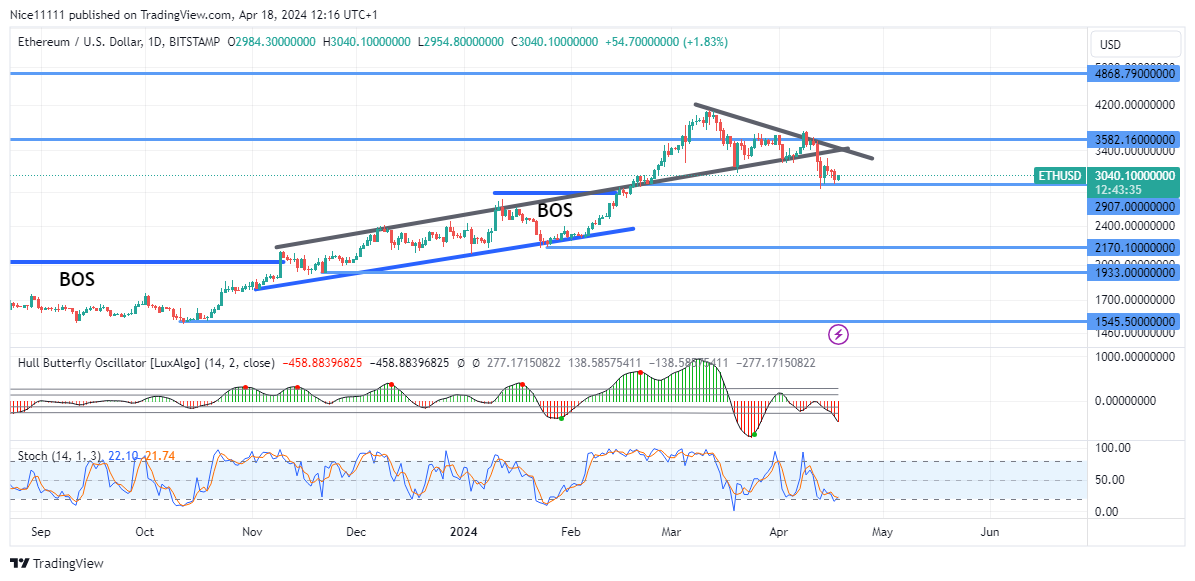
Subsequently, a symmetrical triangle pattern emerged after a breakout above the parallel channel, indicating a slowdown in bullish momentum. This pattern ultimately gave way to a bearish breakout, confirming a reversal in the prevailing trend.
 ETH Key Levels
Supply Levels: $3582.0, $4868.0, $5000.0
Demand Levels: $2907.0, $2170.0, $1933.0
Analyzing Indicators:
The extraordinary steepness of the bullish trajectory witnessed this year was presaged by the occurrence of oversold conditions within the Stochastic indicator, which coincided seamlessly with the indications provided by the Hull Butterfly Indicator at the close of January.
During the formation of the symmetrical triangle in March, the Stochastic indicator signalled an overbought market condition, while the Hull Butterfly indicator indicated a shift towards a downtrend. These indicators accurately anticipated the impending reversal before the bearish breakout.
Presently, market participants are witnessing attempts by bullish entities to establish stability around the $2907.0 demand level. However, failure to reclaim dominance at this juncture may lead to further downward movement, potentially targeting the $2170.0 level.


 Hot Features


