ADVFN Logo ADVFN

We could not find any results for:
Make sure your spelling is correct or try broadening your search.

Trending Now

Toplists

It looks like you aren't logged in.
Click the button below to log in and view your recent history.

Hot Features

Registration Strip Icon for smarter Trade smarter, not harder: Unleash your inner pro with our toolkit and live discussions.

Bitcoin Remains in Consolidation Phase

Share On Facebook
share on Linkedin
Print

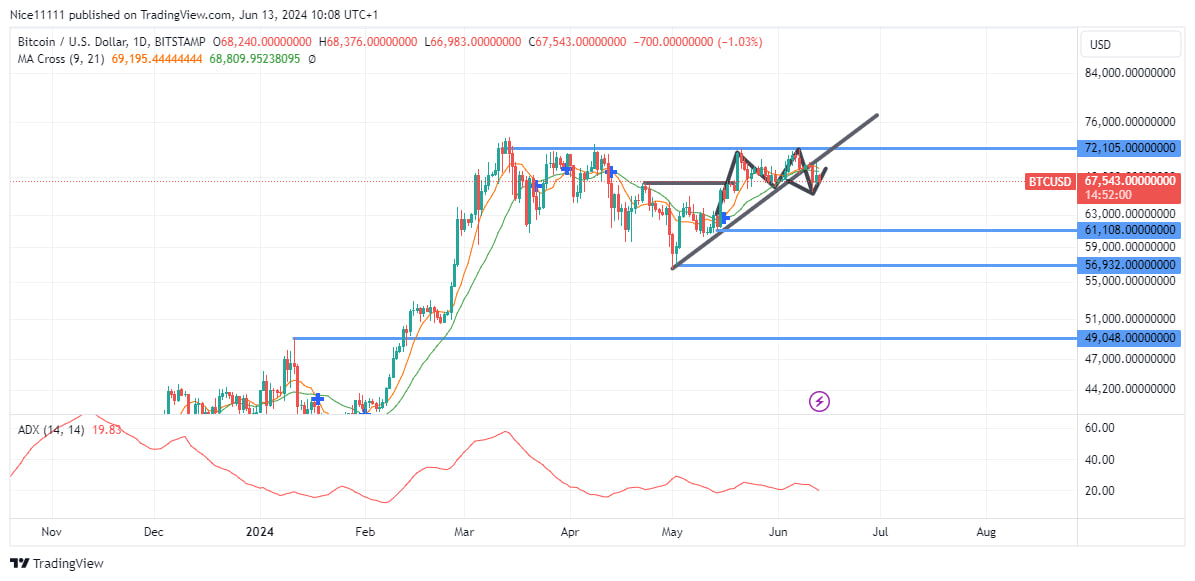
Bitcoin entered a correction phase in March, marked by a consistent pattern of lower highs following a swing high of $73,000. A positive sign emerged in May with a bullish break of the market structure. Analysts used a trendline connecting the lows to predict further price pullbacks. However, at the beginning of June, this trendline was tested, and the subsequent price increase failed to surpass the previous high, resulting in a failed high and the formation of a double top pattern. This pattern indicates market weakness, and the price eventually dipped below the trendline. As of now, Bitcoin (BTC) has yet to break out of its consolidation phase.

©

BTCUSD Key Levels

  • Demand Levels: $61,108.0, $56,932.0, $49,048.0
  • Supply Levels: $72,105.0, $80,000.0, $100,000.0

Bitcoin Remains in Consolidation PhaseTechnical Indicators Analysis

The correction phase commenced after the Moving Averages (Periods 9 and 21) intersected in March. Prior to this, the Moving Averages had spread apart since February, with the shorter Moving Average leading the longer one, indicating a price ascent. The intersection in March signalled a loss of bullish momentum. From February to early March, the ADX (Average Directional Index) rose above 40, indicating a strong trend. However, upon reaching $73,000, the ADX began to decline, showing a weakening trend.

In May, the Moving Averages fell below the daily candles during a bullish break of structure, suggesting a potential upward movement. This momentum was short-lived. Currently, the Moving Averages are positioned around the bodies of the daily candles, indicating a market range without a clear direction above or below. The next major psychological level above the current range appears to be $80,000.0, which remains a significant target.

Learn from market wizards: Books to take your trading to the next level


CLICK HERE TO REGISTER FOR FREE ON ADVFN, the world's leading stocks and shares information website, provides the private investor with all the latest high-tech trading tools and includes live price data streaming, stock quotes and the option to access 'Level 2' data on all of the world's key exchanges (LSE, NYSE, NASDAQ, Euronext etc).

This area of the ADVFN.com site is for independent financial commentary. These blogs are provided by independent authors via a common carrier platform and do not represent the opinions of ADVFN Plc. ADVFN Plc does not monitor, approve, endorse or exert editorial control over these articles and does not therefore accept responsibility for or make any warranties in connection with or recommend that you or any third party rely on such information. The information available at ADVFN.com is for your general information and use and is not intended to address your particular requirements. In particular, the information does not constitute any form of advice or recommendation by ADVFN.COM and is not intended to be relied upon by users in making (or refraining from making) any investment decisions. Authors may or may not have positions in stocks that they are discussing but it should be considered very likely that their opinions are aligned with their trading and that they hold positions in companies, forex, commodities and other instruments they discuss.

Leave A Reply

 
Do you want to write for our Newspaper? Get in touch: newspaper@advfn.com