Hot Features

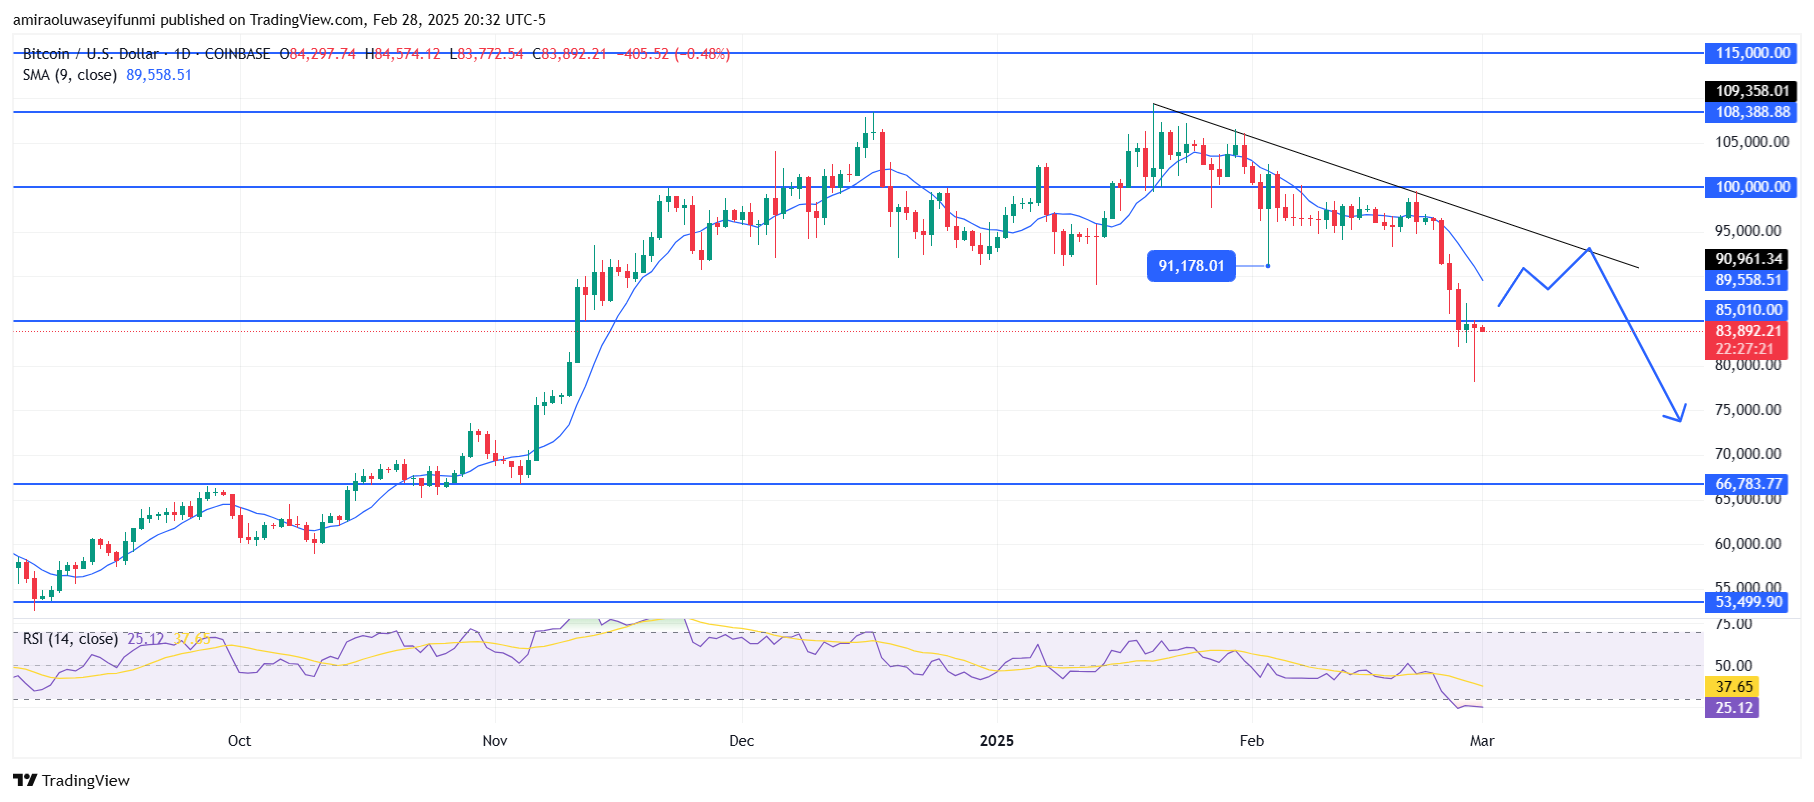
BTCUSD shows bearish momentum with potential short-term retracement ahead. A retraction from the descending trendline is expected before the bearish trend resumes. Price action shows a break below the descending trendline and key support at $85,010, reinforcing bearish sentiment. A temporary bounce could retest the $91,180 level, where resistance from previous price structures and the trendline may limit upside movement. If buyers fail to sustain momentum, the downtrend is likely to resume, pushing BTCUSD lower.

The broader outlook remains bearish, with a likely retracement toward the diagonal resistance before the next leg down. If resistance holds, BTCUSD could drop to $75,000, with further declines targeting the next major support at $66,780. If selling pressure intensifies, an extended bearish move toward $53,500 could unfold. However, a strong break above the trendline would invalidate the immediate bearish outlook.
BTC Key Levels
Supply Levels: $100,000, $108,400, $115,000
Demand Levels: $85,000, $66,800, $53,500
What Are the Indicators Saying?
The 9-period SMA (Simple Moving Average) is currently at $89,560, acting as dynamic resistance, with the price trading below it, confirming the bearish trend. The RSI (Relative Strength Index) is at 25, signaling oversold conditions, suggesting that a short-term relief rally could occur before further downside. The overall trend remains weak as sellers continue to dominate, keeping the price under downward pressure.
Learn from market wizards: Books to take your trading to the next level.