

 Hot Features

In the fast-paced world of trading, momentum indicators play a crucial role in helping traders identify price trends and potential reversals. One such powerful yet often overlooked tool is the Rate of Change (ROC) indicator. The ROC measures the speed at which a security’s price changes over a specified period, offering valuable insights into market momentum. Whether you’re a beginner or an experienced trader, understanding how to use ROC effectively can enhance your trading strategy and decision-making.

In this article, we’ll explore what the ROC indicator is, how it works, and its practical applications in trading. By the end, you’ll have a solid grasp of how to incorporate ROC into your technical analysis toolkit for improved market timing and trend identification.
What is the Rate of Change (ROC) Indicator?
The Rate of Change (ROC) is a momentum-based technical indicator that measures the percentage change in a security’s price over a specified period. It helps traders assess the strength and speed of price movements, indicating whether an asset is gaining or losing momentum.
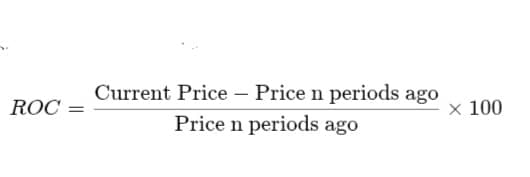
The formula for calculating the ROC is:
Where:
– Current Price = the asset’s latest closing price.
– Price n periods ago = the closing price of the asset ‘n’ periods before.
– n = the chosen time frame (e.g., 10, 14, or 20 periods).
How Does ROC Work?
The ROC indicator generates a momentum oscillator that fluctuates above and below a zero line:
– Positive ROC: Indicates an increase in price momentum, suggesting a bullish trend.
– Negative ROC: Signals declining price momentum, suggesting a bearish trend.
– ROC Crossing Zero: A crossover from negative to positive may signal a potential uptrend, while the opposite may indicate a downtrend.
Uses of the ROC Indicator
1. Identifying Trend Strength:
– A rising ROC confirms strong upward momentum.
– A declining ROC suggests weakening momentum.
2. Spotting Reversals and Divergences:
– If the price is making new highs while ROC is falling, it may indicate a bearish divergence (potential reversal to the downside).
– If the price is making new lows while ROC is rising, it may indicate a bullish divergence (potential reversal to the upside).
3. Overbought and Oversold Conditions:
– Extremely high ROC values may suggest the asset is overbought and due for a pullback.
– Extremely low ROC values may indicate the asset is oversold and due for a bounce.
4. Confirming Breakouts:
– A strong positive ROC after a price breakout from a key resistance level suggests the breakout is valid.
– A weak or declining ROC after a breakout may signal a false breakout.
How to Use it to Generate Signals
The Rate of Change (ROC) indicator is a momentum oscillator that measures the percentage change in price over a given period. Traders use it to identify trends, reversals, and overbought/oversold conditions. Here’s how you can generate trading signals using the ROC:
1. ROC Crosses Above or Below Zero
– Bullish Signal: When the ROC crosses above zero, it suggests increasing upward momentum, indicating a potential buy signal.
– Bearish Signal: When the ROC crosses below zero, it signals increasing downward momentum, suggesting a sell signal.
2. ROC Overbought and Oversold Conditions
– Overbought: If the ROC reaches an extreme high level (e.g., +10 or higher), the asset may be overbought, signaling a possible sell opportunity.
– Oversold: If the ROC reaches an extreme low level (e.g., -10 or lower), the asset may be oversold, suggesting a possible buy opportunity.
3. Divergence Between Price and ROC
– Bullish Divergence: When the price makes a lower low, but ROC forms a higher low, it suggests weakening selling pressure and a potential reversal upward (buy signal).
– Bearish Divergence: When the price makes a higher high, but ROC forms a lower high, it signals weakening buying pressure and a possible reversal downward (sell signal).
4. Trend Confirmation
– When combined with a moving average (e.g., 50-day MA), a positive ROC reinforces an uptrend, while a negative ROC confirms a downtrend.

The Rate of Change Indicator in Action
In early October, we observed the ROC line crossing from the negative zone into the positive zone on October 9. Although the market initially stalled that day, the ROC remained positive, leading to a strong bullish rally. As a result, the price surged steadily from $0.4, eventually peaking at $0.6. Later in the month, on October 24, the ROC line confirmed a bearish reversal as it crossed back into negative territory. This shift marked the beginning of a downtrend, which ultimately found support around the $0.4 level, the key support level.
Conclusion
The Rate of Change (ROC) indicator is a valuable tool for traders seeking to measure market momentum and anticipate trend shifts. By analyzing price velocity, ROC helps traders identify potential buy and sell signals, confirm breakouts, and detect overbought or oversold conditions. As demonstrated in our October market analysis, ROC can effectively signal both bullish and bearish reversals, allowing traders to make informed decisions. However, like all technical indicators, ROC works best when used alongside other tools such as moving averages and support/resistance levels to improve accuracy. Mastering its application can significantly enhance trading strategies, leading to better market timing and risk management.
Learn from market wizards: Books to take your trading to the next level


