Hot Features

ETHUSD faces rejection at resistance signaling potential bearish continuation. Price action reveals that ETHUSD is struggling to break above a key resistance zone between $1,790 and $1,800, which has been tested multiple times without success. The market recently completed a break of structure (BOS) but is now stalling within a clear supply zone marked by the rectangular box. A strong rejection at this level has led to lower highs forming, signaling potential distribution. Below this resistance, immediate support is located around $1,750, followed by a major support zone at $1,530, which aligns with previous consolidation and reaction levels.
Given the current weakness and repeated rejection at $1,800, ETHUSD is poised for a bearish move in the coming sessions. If the $1,750 support breaks, a drop toward $1,530 is likely, and if bearish momentum accelerates, the price could extend further downward to $1,250. These levels align with historical demand zones and previous Fibonacci retracement targets. To invalidate this bearish outlook, ETHUSD would need a strong breakout above $1,800 and confirmation above $1,880, flipping resistance into support. Until then, the prevailing structure favors a downside move.
ETH Key Levels
Supply Levels: $2150, $2860, $4110
Demand Levels: $1530, $1250, $880
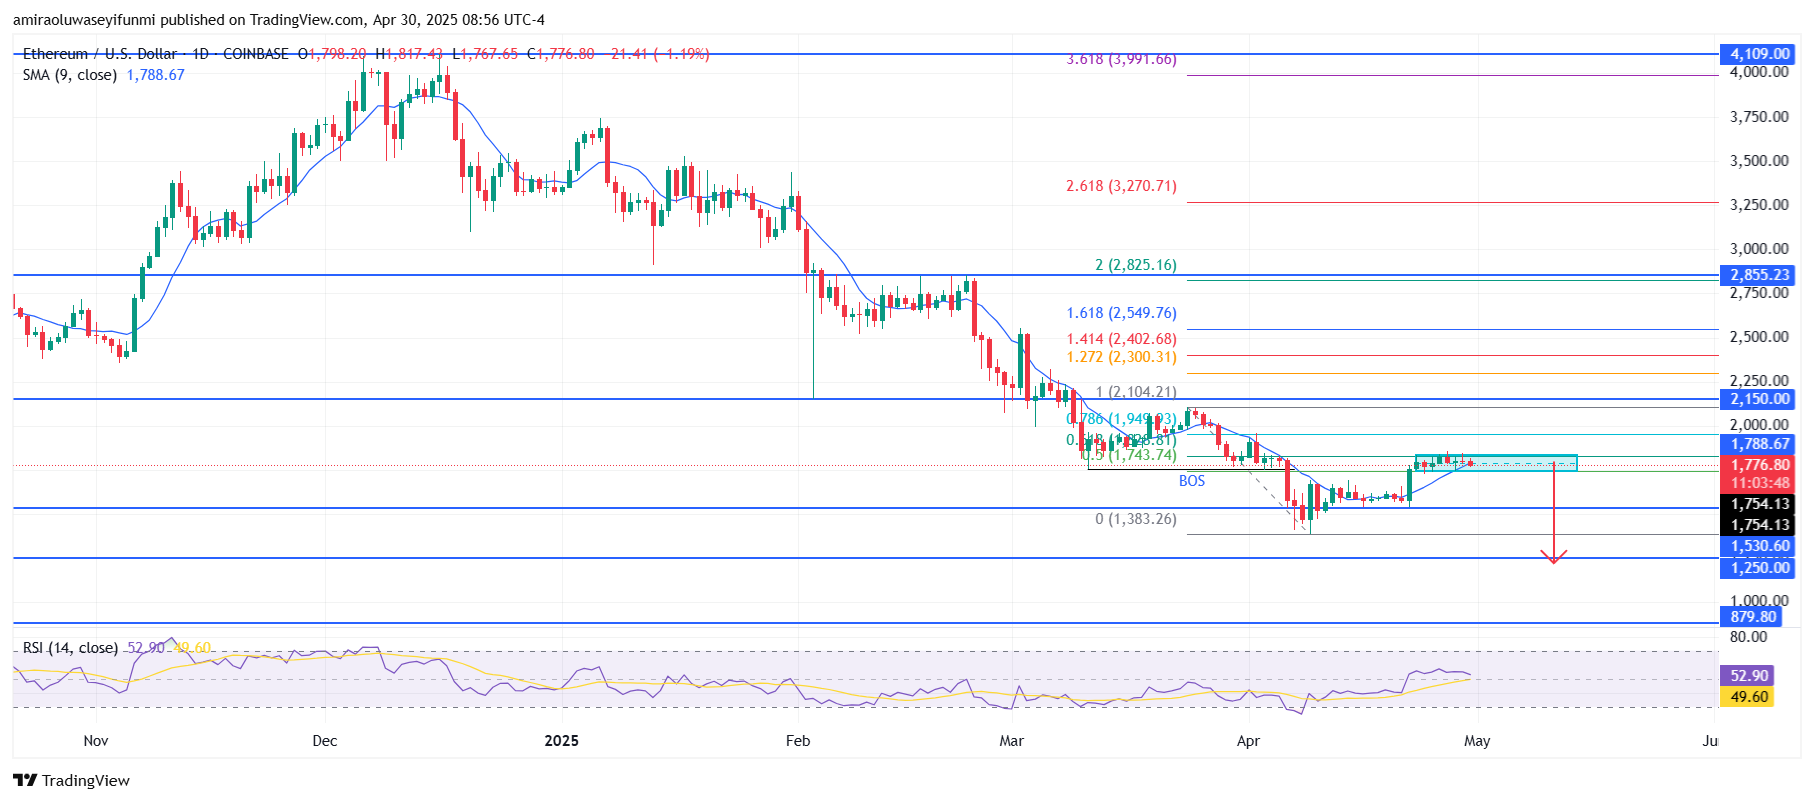
What are the indicators saying?
On the daily chart, ETHUSD is currently trading below the 9-day Simple Moving Average (SMA), which stands around $1,790, indicating weakening bullish momentum. The Relative Strength Index (RSI) is hovering around 53.01, with a slight downward slope, suggesting that buying pressure is losing steam. As price fails to maintain strength above the moving average and RSI flattens near neutral territory, the technical bias leans bearish in the short term. This shift in momentum may reflect an impending reversal or correction from recent gains.
Learn from market wizards: Books to take your trading to the next level