ADVFN ADVFN

We could not find any results for:
Make sure your spelling is correct or try broadening your search.

Trending Now

Toplists

It looks like you aren't logged in.
Click the button below to log in and view your recent history.

Hot Features

Registration Strip Icon for smarter Trade smarter, not harder: Unleash your inner pro with our toolkit and live discussions.

Bitcoin (BTCUSD) Holds Bullish Structure With Continuation Likely Toward Resistance Zones

Share On Facebook
share on Linkedin
Print

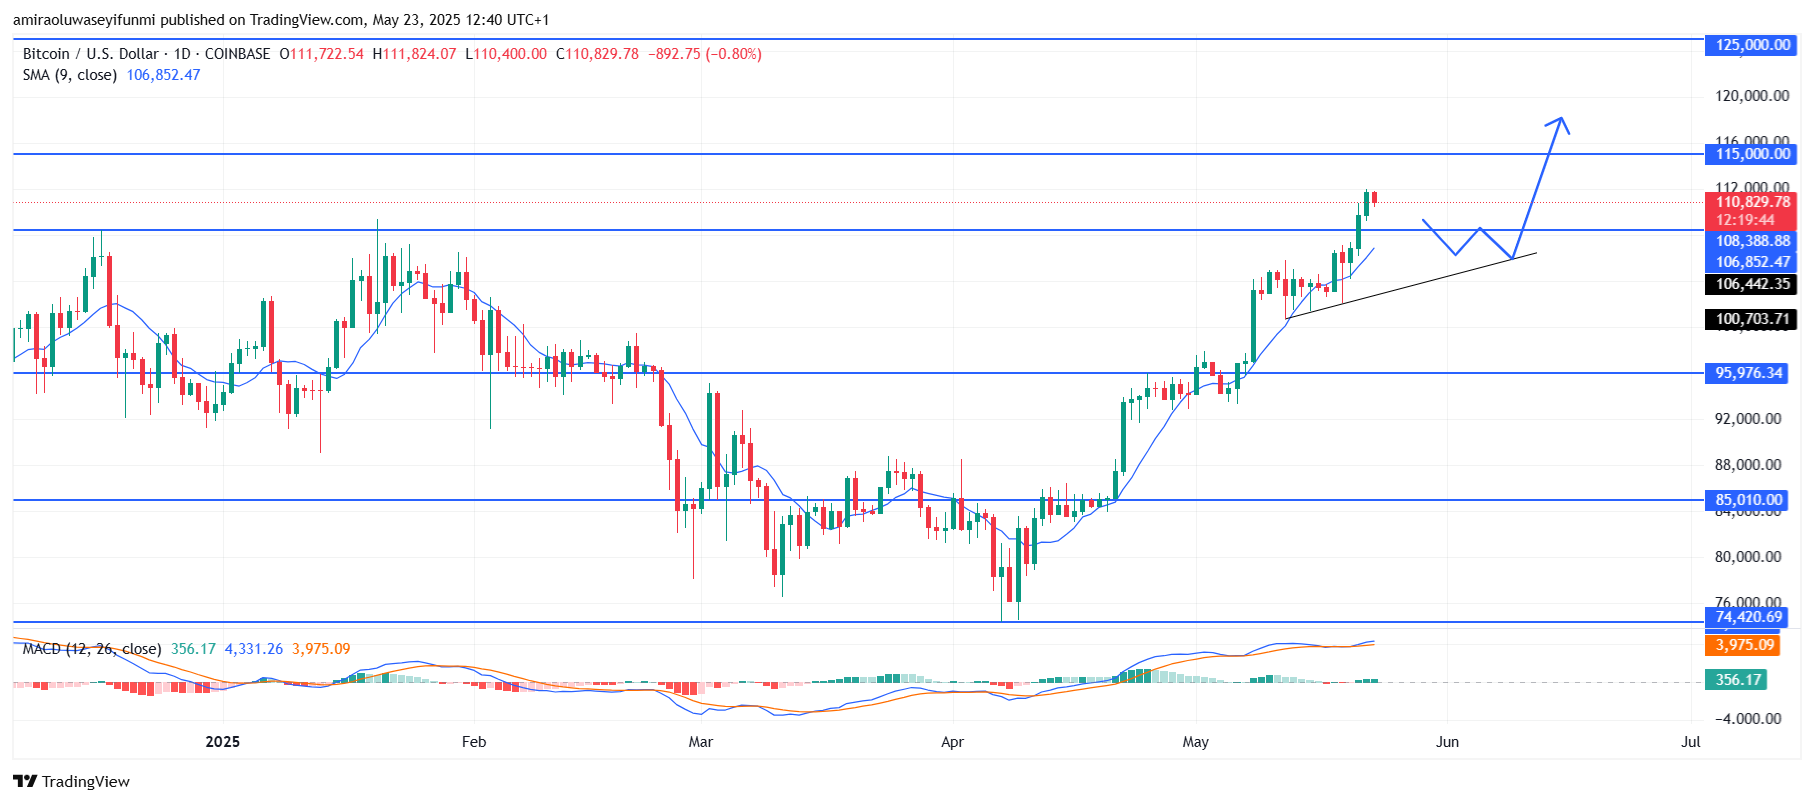
BTCUSD holds its bullish structure with continuation likely toward resistance zones. Price action confirms bullish dominance as BTCUSD continues to print higher highs and higher lows. After breaking through the key resistance zone at $108,390, the price surged past $110,000 and is now consolidating slightly below the $112,000 level. The ascending trendline and the SMA have acted as solid support, catching multiple pullbacks and fueling continuation rallies. The resistance at $108,390 may now function as a strong support zone, with further validation from the price’s respect for the trendline.

©

Looking ahead, BTCUSD is poised to continue its upward move. A brief consolidation or minor pullback toward the $108,400–$106,850 range could provide a fresh buying opportunity before the next leg higher. Once the price breaks above $112,000 convincingly, it may target the next significant resistance of around $115,000. If bullish momentum persists beyond that, an extended rally toward $125,000 becomes increasingly likely. As long as the price holds above the ascending trendline and the $106,440 support zone, the broader structure remains bullish with a high probability for further upside.

Bitcoin (BTCUSD) Holds Bullish Structure With Continuation Likely Toward Resistance ZonesBTC Key Levels

Supply Levels: $108,390, 115,000, $125,000
Demand Levels: $95,980, $85,010, $74,420

What are the indicators saying?

The BTCUSD market remains in a strong bullish position, supported by technical indicators. The 9-day Simple Moving Average (SMA), currently around $106,850, is trending upward and acting as dynamic support, indicating sustained buying pressure.

The Moving Average Convergence Divergence (MACD) also reinforces this sentiment, with the MACD line positioned above the signal line and histogram bars staying in positive territory, signaling momentum remains in favor of the bulls. Both indicators together suggest the current trend is healthy and has room for further growth.

Learn from market wizards: Books to take your trading to the next level


CLICK HERE TO REGISTER FOR FREE ON ADVFN, the world's leading stocks and shares information website, provides the private investor with all the latest high-tech trading tools and includes live price data streaming, stock quotes and the option to access 'Level 2' data on all of the world's key exchanges (LSE, NYSE, NASDAQ, Euronext etc).

This area of the ADVFN.com site is for independent financial commentary. These blogs are provided by independent authors via a common carrier platform and do not represent the opinions of ADVFN Ltd. ADVFN Ltd does not monitor, approve, endorse or exert editorial control over these articles and does not therefore accept responsibility for or make any warranties in connection with or recommend that you or any third party rely on such information. The information available at ADVFN.com is for your general information and use and is not intended to address your particular requirements. In particular, the information does not constitute any form of advice or recommendation by ADVFN.COM and is not intended to be relied upon by users in making (or refraining from making) any investment decisions. Authors may or may not have positions in stocks that they are discussing but it should be considered very likely that their opinions are aligned with their trading and that they hold positions in companies, forex, commodities and other instruments they discuss.

Comments are closed

 
Do you want to write for our Newspaper? Get in touch: newspaper@advfn.com