Hot Features

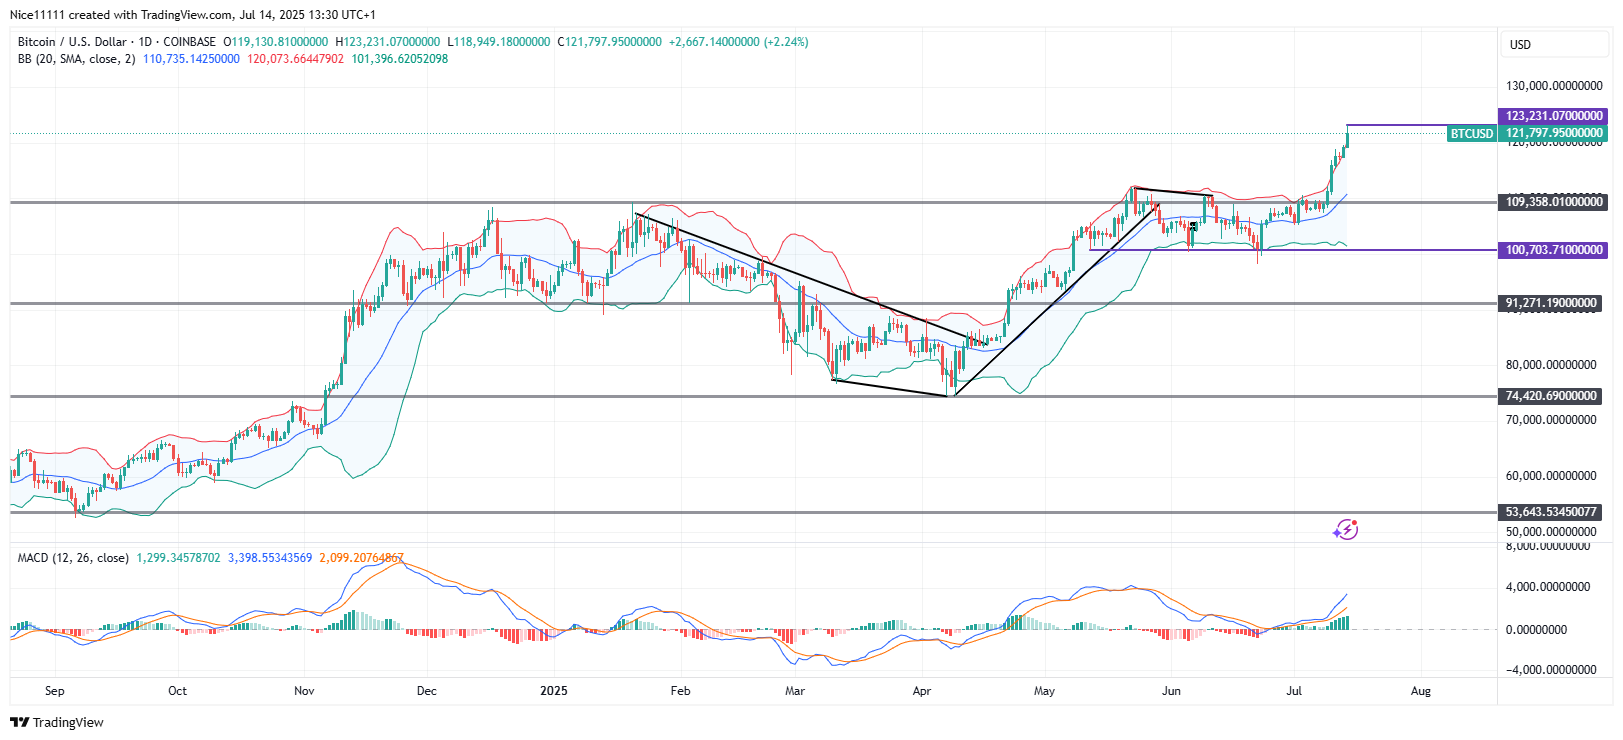
Bitcoin has created a new all-time high (ATH), marking a significant milestone in its bullish trajectory. The market initially encountered strong resistance around $109,358.0. An attempt to break this level in January failed, followed by a false breakout in May. However, after forming a solid triple bottom at $100,703.0, the price rallied with conviction. The initial surge met a temporary halt at $109,358, but momentum soon overcame resistance, resulting in a successful breakout.

The breakout has been remarkably energetic, with multiple Fair Value Gaps (FVGs) forming as the price aggressively pushed upwards, ultimately reaching $123,232.
 Bitcoin Key Levels
Demand Levels: $100,358.0, $100,703.0, $91,271.0
Supply Levels: $130,000.0, $140,000.0, $150,000.0
What Are the Indicators Saying?
Between May and June, Bitcoin’s price fluctuated within a tight range, consistently testing both the upper and lower bands of the Bollinger indicator—suggesting consolidation and indecision. In June, the MACD (Moving Average Convergence and Divergence) lines crossed bullishly, with green histogram bars elongating thereafter, confirming bullish momentum and supporting the breakout that led to the ATH.
The current bullish surge shows no significant signs of exhaustion. A bullish order block around $118,134.0 could serve as a viable re-entry point for buyers. However, this zone lacks a clearly defined swing low, implying a slightly higher risk for long entries.
Learn from market wizards: Books to take your trading to the next level