Hot Features

Last week’s Trump’s / Comey cover-up feel like a distant memory as equity markets re-test all-time highs.
Let’s take a look at some of the powerful price patterns that are taking shape now across the S&P 500 and the FTSE 100.
S&P 500
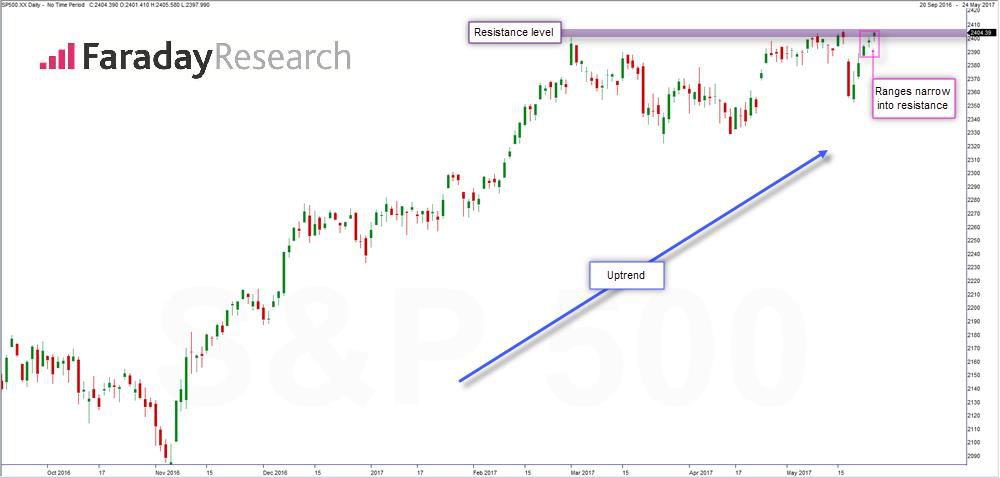
With US politics at the epi-centre of the recent selloff, let’s start here. The bullish US equity backdrop is of course old news and hence I won’t rehash the drivers behind the indices ‘post-Trump’ rally here.
What should be grabbing traders attention is the indices range compression into the well-established 2,401 – 2,405 resistance zone. This week started with the narrowest daily range in 4, Tuesday then delivered the narrowest daily range in 7 and this was topped off yesterday by the combined 2-day range coming in as the narrowest in 20.
Equities have a statistical tendency to undergo range expansion following periods of compression and with this in mind, it’s fair to say that US equities are setting up for a big move.
The recent bullish backdrop for the S&P 500 indicates that a break of resistance is on the cards. Were this to happen we would have a clear change in market structure which in turn would pave the way for the index to trend higher in line with the upswing seen from November through to the end of February.
Of course, breaking above a key resistance level is easier said than done. Were we to see selling pressure halt the recent rally or a break and failure to hold above 2,405 this would re-enforce the significant of this level and most certainly reinvigorate the bears calling the top.
FTSE 100
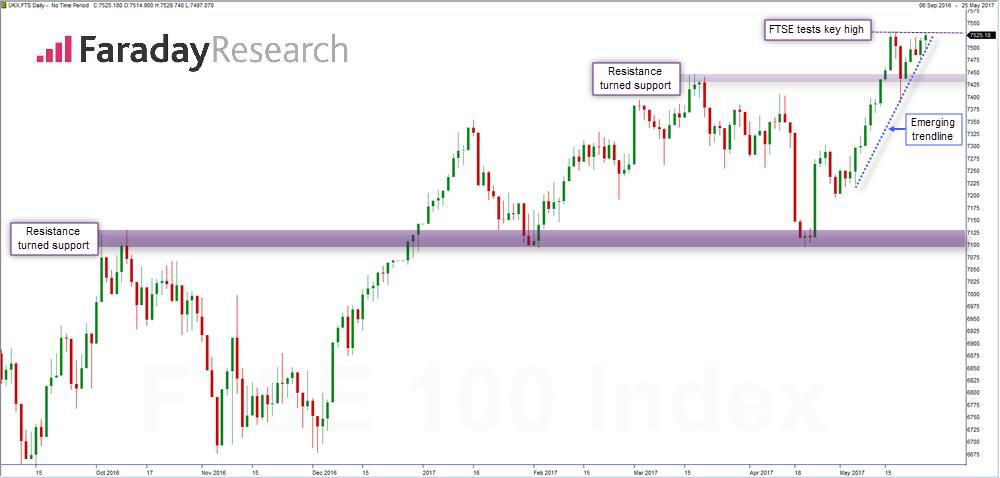
Turning our attention to the FTSE 100 the picture is just as, if not more interesting. Taking a step back we highlight that the index staircasing higher over the past nine months has seen three key structural levels formed; these are market A, B & C on the below graph.
The FTSE 100 bouncing off a major resistance turned support zone and subsequently powering through the next key structural level at 7,430 – 7,447 earlier this month, sets the scene for the recent upswing to roll on.
As is the way with equities, broken resistance zone often re-emerge as support levels and this is exactly what happen last week. We note that the FTSE 100 found support at price zone B after an initial lurch lower, following the “let this go” driven reversal in risk appetite making its way across the pond. That said, clear evidence investors are willing to buy this dips gives us confidence that a net long bias is still the way to go.
Focusing on more recent price action does nothing to dampen this view. Firstly, a series of higher daily lows reaffirms the trajectory of the recent uptrend. With the index pressing up into all-time highs and in the process moving into compression mode, the signs again point to range expansion for UK equities in the near term. With last week’s buying of the dip offering a clear indication that buying demand is strong we foresee a bullish break higher.
However, before we get too excited, let’s not forget the importance of watching the events over in the US (as last week reminds us). And with the S&P 500 fighting against a long held resistance level it is still key that traders remain nimble and ready to react if UK and US equities falter at their current levels.
Faraday Research offers real time FX and Equity trade signals from qualified analysts. Click here to try us free.