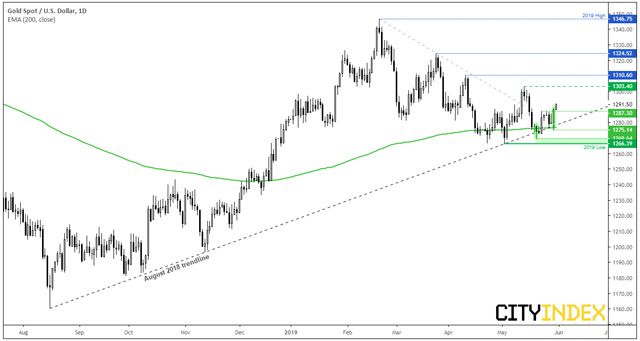
We outlined a case as to why we thought gold’s corrective low is in and, despite a deeper than anticipated pullback, a longer-term bullish case above $1266.0 remains in-tact.
We remain cautiously bullish above $1266
Gold has declined nearly 6% from the 2019 high to the 2019 low. Yet as this follows on from a 16% rally from 2018’s low, it falls within the realm of a respectable pullback. Structurally, the August 2018 trendline continues to hold, barring a few failed attempts to break lower. And we now have two higher lows above 1266, one of which includes the bullish engulfing candle yesterday from the 200-day eMA shows a pick-up in gold demand.

- Look for 1287.30 to hold as support for a move to 1300.
- The 1300-1303 zone make an obvious interim target and an area likely to instil profit taking, but again we would look to buy any dips following a retracement from this level.
- Over the medium-term, price action could remain choppy, yet with our core bullish stance we prefer to buy any dips above or around the trendline.

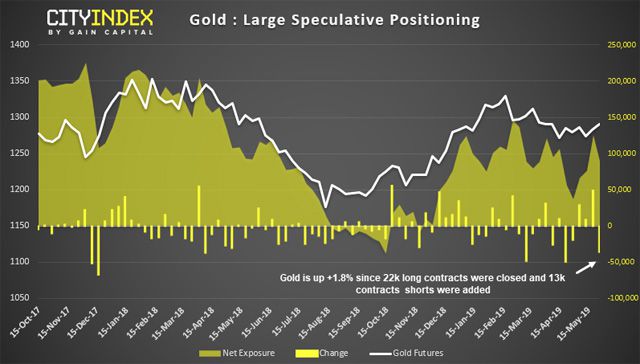
Traders remain net-long gold although, as noted in Monday’s COT report, trades had reduced bullish exposure by 37.5k contract by closing -22.7k long contracts and opening 13k short contracts. As gold has appreciated 1.8% since the report was compiled (on the 21st May) it suggests bears have been squeezed and fresh longs have been added above the 1266.39 low. Of course, this is an assumption and we won’t see this in the data until next Friday’s COT report. But my monitoring price action between reports it allows us to gauge a switch in possible sentiment between each report.
City Index: Spread Betting, CFD and Forex Trading on 12,000+ global markets including Indices, Shares, Forex and Bitcoin. Click here to find out more.


 Hot Features


