XRP Price Continuation After Crash Below $2.4? New Targets Emerge
26 February 2025 - 8:30AM
NEWSBTC
XRP’s recent price movements have followed a pattern that crypto
analyst Javon Marks believes signals the potential for a strong
continuation rally. Sharing his analysis on the social media
platform X, Marks pointed to a “hidden bullish divergence” on XRP’s
daily candlestick chart. Despite the ongoing price crash, the
presence of this bullish divergence opens up new bullish targets
for the XRP price. XRP’s Price Crash Worsens, But Hidden Bullish
Divergence Suggests Next Move XRP’s price action has faced
consistent downward pressure over the past week, with the decline
intensifying in the past 24 hours. At the time of writing, XRP has
dropped by approximately 13% in the past 24 hours and is on the
verge of retesting a crucial support level at $2. Related Reading:
XRP Price Breaks Out Of Symmetrical Triangle Pattern, Why The
Target Is $8 However, an interesting analysis shows that this
decline is part of a hidden bull divergence pattern, where both the
price and the RSI indicators are creating a series of highs and
lows on the 1-day candlestick timeframe. This interesting pattern
is characterized by higher lows and higher highs on the XRP price
chart, while there’s a series of lower lows and lower highs on the
RSI indicator. This divergent formation between the
cryptocurrency’s price and the RSI is known to be bullish.
Particularly, it suggests the selling pressure shown by the RSI
could be slowing down. Javon Marks emphasized that XRP is preparing
for a “massive continuation wave up” and that the necessary
technical confirmations for such a move are already in place. This
assertion builds upon his earlier February 18 analysis, where he
described the hidden bullish divergence as forming in a “textbook
fashion. Crash To Reverse Soon? Price Targets To Watch According to
Javon Mark’s projection, an upside move would see the XRP price
eventually creating a higher high, as expected from the bullish
divergence pattern. In terms of a specific price target, Mark’s
projection shows that the next peak could reach at least $3.80. If
realized, this would push XRP beyond its current all-time high of
$3.40. Related Reading: XRP Price Rallies To ATH At $3.4,
Here’s What’s Driving It And Why The Pump Will Continue However,
this outlook hinges on the XRP price holding above the bullish
divergence support at $2. Any sustained breakdown below this
threshold could challenge the strength of the projected rally and
alter the bullish outlook. Adding to this perspective, Marks also
noted the similarity between XRP’s consolidation in the past few
weeks since it reached $3.36 and that of a consolidation after a
strong rally in the first half of 2017 after a strong rally.
Although the current consolidation phase has lasted longer than the
one observed back then, both formations share key structural
similarities. The 2017 consolidation ultimately led to a
continuation rally that pushed the XRP price to new highs. If
history repeats itself, the present consolidation could also be a
precursor to another significant leg up. At the time of writing,
XRP is trading at $2.15, down by 13.2% and 15.9% in the past 24
hours and seven days, respectively, and is now in danger of losing
the $2.0 support soon. Featured image from Adobe Stock, chart from
Tradingview.com
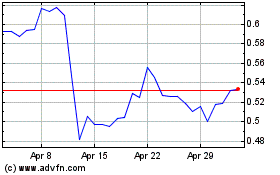
Ripple (COIN:XRPUSD)
Historical Stock Chart
From Jan 2025 to Feb 2025

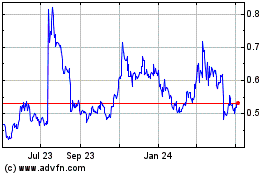
Ripple (COIN:XRPUSD)
Historical Stock Chart
From Feb 2024 to Feb 2025
