UNITED STATES
SECURITIES AND EXCHANGE COMMISSION
Washington, D.C. 20549
FORM 6-K
REPORT OF FOREIGN
PRIVATE ISSUER PURSUANT TO RULE 13a-16 OR 15d-16 UNDER THE SECURITIES EXCHANGE ACT OF 1934
For the month of November 2023
Commission File Number: 001-39155
XP Inc.
(Exact name of registrant as specified in its
charter)
20, Genesis Close
Grand Cayman, George Town
Cayman Islands KY-1-1208
+55 (11) 3075-0429
(Address of principal executive office)
Indicate by check mark whether the registrant files
or will file annual reports under cover of Form 20-F or Form 40-F:
Indicate by check mark if the registrant is submitting
the Form 6-K in paper as permitted by Regulation S-T Rule 101(b)(1):
Indicate by check mark if the registrant is submitting
the Form 6-K in paper as permitted by Regulation S-T Rule 101(b)(7):
SIGNATURE
Pursuant to the requirements of the Securities
Exchange Act of 1934, the registrant has duly caused this report to be signed on its behalf by the undersigned, thereunto duly authorized.
| |
|
XP Inc. |
| |
|
|
| |
|
|
| |
|
|
By: |
/s/ Bruno Constantino Alexandre dos Santos |
| |
|
|
|
Name: |
Bruno Constantino Alexandre dos Santos |
| |
|
|
|
Title: |
Chief Financial Officer |
Date: November 13, 2023
EXHIBIT INDEX
Exhibit 99.1

|
|
3Q23 Earnings Release
November 13th,
2023
|
XP Inc. Reports Third Quarter 2023
Results
São Paulo, Brazil, November
13, 2023 – XP Inc. (NASDAQ: XP) (“XP” or the “Company”), a leading tech-enabled platform and a trusted pioneer
in providing low-fee financial products and services in Brazil, reported today its financial results for the third quarter of 2023.
Summary
| Operating Metrics (unaudited) |
3Q23 |
3Q22 |
YoY |
2Q23 |
QoQ |
| Total Client Assets (in R$ bn) |
1,080 |
925 |
17% |
1,024 |
6% |
| Total Net Inflow (in R$ bn) |
48 |
35 |
38% |
22 |
118% |
| Annualized Retail Take Rate |
1.34% |
1.33% |
1 bps |
1.30% |
4 bps |
| Active Clients (in '000s) |
4,412 |
3,805 |
16% |
4,013 |
10% |
| Headcount (EoP) |
6,699 |
6,948 |
-4% |
6,002 |
12% |
| IFAs (in '000s) |
14.3 |
11.6 |
23% |
14.1 |
1% |
| Retail DATs (in mn) |
2.1 |
2.3 |
-9% |
2.2 |
-2% |
| Retirement Plans Client Assets (in R$ bn) |
67 |
58 |
15% |
64 |
4% |
| Cards TPV (in R$ bn) |
10.7 |
6.6 |
62% |
9.7 |
11% |
| Credit Portfolio (in R$ bn) |
19.9 |
16.3 |
22% |
17.9 |
11% |
| |
|
|
|
|
|
| Financial Metrics (in R$ mn) |
3Q23 |
3Q22 |
YoY |
2Q23 |
QoQ |
| Gross revenue |
4,364 |
3,811 |
14% |
3,728 |
17% |
| Retail |
3,179 |
2,629 |
21% |
2,892 |
10% |
| Institutional |
386 |
577 |
-33% |
385 |
0% |
| Corporate & Issuer Services |
519 |
436 |
19% |
283 |
83% |
| Other |
281 |
170 |
65% |
167 |
68% |
| Net Revenue |
4,132 |
3,620 |
14% |
3,549 |
16% |
| Gross Profit |
2,896 |
2,615 |
11% |
2,402 |
21% |
| Gross Margin |
70.1% |
72.2% |
-216 bps |
67.7% |
240 bps |
| EBT |
1,157 |
983 |
18% |
968 |
20% |
| EBT Margin |
28.0% |
27.2% |
86 bps |
27.3% |
74 bps |
| Net Income |
1,087 |
1,031 |
5% |
977 |
11% |
| Net Margin |
26.3% |
28.5% |
-218 bps |
27.5% |
-123 bps |
| Basic EPS (in R$) |
1.99 |
1.85 |
7% |
1.85 |
8% |
| Diluted EPS (in R$) |
1.96 |
1.80 |
9% |
1.83 |
7% |
| ROAE¹ |
22.6% |
24.4% |
-183 bps |
22.0% |
58 bps |
| ROAA² |
2.6% |
3.3% |
-69 bps |
2.6% |
1 bps |
____________________
1 – Annualized
Return on Average Equity.
2 – Annualized
Return on Average Adjusted Assets. Adjusted Assets excludes Retirement Plans Liabilities and Float Balance.
Discussion of Results
Total Gross Revenue
Gross revenue was R$4.4 billion in 3Q23, up 17%
QoQ and 14% YoY, primarily driven by growth in our Retail revenue year-over-year and a strong recovery in Corporate & Issuer Services
quarter-over-quarter. Modal’s financials have been fully incorporated in 3Q23, accounting for R$161 million in Gross Revenue for
the quarter.
Retail Revenue
| (in R$ mn) |
3Q23 |
3Q22 |
YoY |
2Q23 |
QoQ |
| Retail Revenue |
3,179 |
2,629 |
21% |
2,892 |
10% |
| Equities |
1,131 |
1,120 |
1% |
1,064 |
6% |
| Fixed Income |
718 |
489 |
47% |
578 |
24% |
| Funds Platform |
323 |
282 |
15% |
341 |
-5% |
| Retirement Plans |
98 |
85 |
15% |
87 |
12% |
| Cards |
259 |
146 |
77% |
232 |
12% |
| Credit |
49 |
40 |
24% |
44 |
13% |
| Insurance |
36 |
21 |
72% |
36 |
1% |
| Other Retail |
565 |
447 |
26% |
511 |
11% |
| Annualized Retail Take Rate |
1.34% |
1.33% |
1 bps |
1.30% |
4 bps |
Retail revenue was R$3.2 billion in 3Q23, up 10%
QoQ and 21% YoY. Retail revenue growth was driven by a combination of:
| (1) | Year-over-year and sequential growth in Fixed Income revenue, led by a strong performance in primary markets
in the quarter; |
| (2) | Strong continued growth in Cards revenue, which grew 77% YoY |
Retail-related revenue in 3Q23 represented 68%
of consolidated Net Income from Financial Instruments, as per the Accounting Income Statement.
Take Rate
Annualized Retail Take Rate was 1.34% in 3Q23,
up 4 bps QoQ.
Institutional Revenue
Institutional revenue was R$386 million in 3Q23,
stable QoQ and down 33% YoY. Year-over-year decrease is mainly due to a tough comp in 3Q22, with a lot of hedging demand in the pre-elections
period.
Institutional revenue in 3Q23 accounted for 13%
of consolidated Net Income from Financial Instruments, as per the Accounting Income Statement.
Corporate & Issuer Services Revenue
Corporate & Issuer Services revenue totaled
R$519 million in 3Q23, up 83% QoQ and 19% YoY. The sequential increase in Corporate & Issuer Services revenue was due to the growth
in Issuer Services revenue, mainly related to a strong pick-up in DCM activity in the quarter.
Corporate and Issuer Services related revenues
in 3Q23 represented 9% of consolidated Net Income from Financial Instruments, as per the Accounting Income Statement.
Other Revenue
Other revenue was R$281 million in 3Q23, up 68%
QoQ and 65% YoY.
Other revenue in 3Q23 accounted for 11%
of consolidated Net Income from Financial Instruments, as per the Accounting Income Statement.
Costs of Goods Sold and Gross Margin
Gross Margin was 70.1% in 3Q23 versus 67.7% in
2Q23 and 72.2% in 3Q22. Sequential improvement in gross margin was mainly related to better revenue mix between products and channels
in the quarter.
SG&A Expenses3
| (in R$ mn) |
3Q23 |
3Q22 |
YoY |
2Q23 |
QoQ |
| Total SG&A3 |
(1,547) |
(1,501) |
3% |
(1,246) |
24% |
| People |
(1,048) |
(1,057) |
-1% |
(899) |
17% |
| Salary and Taxes |
(396) |
(377) |
5% |
(344) |
15% |
| Bonuses |
(486) |
(510) |
-5% |
(428) |
13% |
| Share Based Compensation |
(166) |
(171) |
-3% |
(127) |
30% |
| Non-people |
(499) |
(444) |
12% |
(347) |
44% |
| LTM Compensation Ratio4 |
25.7% |
29.8% |
-409 bps |
26.8% |
-105 bps |
| LTM Efficiency Ratio5 |
37.3% |
41.7% |
-444 bps |
38.3% |
-108 bps |
| Headcount (EoP) |
6,699 |
6,948 |
-4% |
6,002 |
12% |
SG&A3 expenses totaled R$1.5 billion
in 3Q23, up 24% QoQ and 3% YoY. The sequential increase is in line with our annual guidance of R$5.0 to 5.5 billion in total SG&A3
for the full year of 2023. The main increases in SG&A during the quarter came from:
| (1) | Non-people expenses, mainly related to Expert event that happened during 3Q23; |
| (2) | Modal expenses incorporation, which accounted for R$111 million in 3Q23. |
Our last twelve months (LTM) compensation ratio4
in 3Q23 was 25.7%, an improvement from 29.8% and 26.8% in 3Q22 and 2Q23, respectively. Also, our LTM efficiency ratio5 reached
37.3% in 3Q23, compared to 41.7% and 38.3% in the same periods.
____________________
3 - Total SG&A
and non-people SG&A exclude revenue from incentives from Tesouro Direto, B3.
4 - Compensation
ratio is calculated as People SG&A (Salary and Taxes, Bonuses and Share Based Compensation) divided by Net Revenue.
5 - Efficiency ratio
is calculated as SG&A ex-revenue from incentives from Tesouro Direto, B3, and others divided by Net Revenue.
Earnings Before Taxes
EBT, a good proxy for earnings power, was R$1.2
billion in 3Q23, up 20% QoQ and 18% YoY, mainly driven by revenue growth and improving operating leverage in the quarter. EBT Margin was
28.0%, up 74 bps QoQ and 86 bps YoY, in line with our medium-term annual guidance of 26% to 32% between 2023 and 2025.
Net Income and EPS
In 3Q23, Net Income was R$1.1 billion, up 11% QoQ
and 5% YoY. Basic EPS was R$1.99, up 8% QoQ and 7% YoY. Fully diluted EPS was R$1.96, up 7% QoQ and 9% YoY.
Other Information
Webcast and Conference Call Information
The
Company will host a webcast to discuss its third quarter financial results on Monday, November 13th, 2023, at 5:00 pm ET (7:00
pm BRT). To participate in the earnings webcast please subscribe at 3Q23 Earnings Web Meeting.
The replay will be available on XP’s investor relations website at https://investors.xpinc.com/
Investor Relations Contact
ir@xpi.com.br
Important Disclosure
In reviewing the information contained in this
release, you are agreeing to abide by the terms of this disclaimer. This information is being made available to each recipient solely
for its information and is subject to amendment. This release is prepared by XP Inc. (the “Company,” “we” or “our”),
is solely for informational purposes. This release does not constitute a prospectus and does not constitute an offer to sell or the solicitation
of an offer to buy any securities. In addition, this document and any materials distributed in connection with this release are not directed
to, or intended for distribution to or use by, any person or entity that is a citizen or resident or located in any locality, state, country
or other jurisdiction where such distribution, publication, availability or use would be contrary to law or regulation or which would
require any registration or licensing within such jurisdiction.
This release was prepared by the Company. Neither
the Company nor any of its affiliates, officers, employees or agents, make any representation or warranty, express or implied, in relation
to the fairness, reasonableness, adequacy, accuracy or completeness of the information, statements or opinions, whichever their source,
contained in this release or any oral information provided in connection herewith, or any data it generates and accept no responsibility,
obligation or liability (whether direct or indirect, in contract, tort or otherwise) in relation to any of such information. The information
and opinions contained in this release are provided as at the date of this release, are subject to change without notice and do not purport
to contain all information that may be required to evaluate the Company. The information in this release is in draft form and has not
been independently verified. The Company and its affiliates, officers, employees and agents expressly disclaim any and all liability which
may be based on this release and any errors therein or omissions therefrom. Neither the Company nor any of its affiliates, officers, employees
or agents makes any representation or warranty, express or implied, as to the achievement or reasonableness of future projections, management
targets, estimates, prospects or returns, if any.
The information contained in this release does
not purport to be comprehensive and has not been subject to any independent audit or review. Certain of the financial information as of
and for the periods ended of December 31, 2021 and December 31, 2020, 2019, 2018 and 2017 has been derived from audited financial statements
and all other financial information has been derived from unaudited interim financial statements. A significant portion of the information
contained in this release is based on estimates or expectations of the Company, and there can be no assurance that these estimates or
expectations are or will prove to be accurate. The Company’s internal estimates have not been verified by an external expert, and
the Company cannot guarantee that a third party using different methods to assemble, analyze or compute market information and data would
obtain or generate the same results.
Statements in the release, including those regarding
the possible or assumed future or other performance of the Company or its industry or other trend projections, constitute forward-looking
statements. These statements are generally identified by the use of words such as “anticipate,” “believe,” “could,”
“expect,” “should,” “plan,” “intend,” “estimate” and “potential,”
among others. By their nature, forward-looking statements are necessarily subject to a high degree of uncertainty and involve known and
unknown risks, uncertainties, assumptions and other factors because they relate to events and depend on circumstances that will occur
in the future whether or not outside the control of the Company. Such factors may cause actual results, performance or developments to
differ materially from those expressed or implied by such forward-looking statements and there can be no assurance that such forward-looking
statements will prove to be correct. These risks and uncertainties include factors relating to: (1) general economic, financial, political,
demographic and business conditions in Brazil, as well as any other countries we may serve in the future and their impact on our business;
(2) fluctuations in interest, inflation and exchange rates in Brazil and any other countries we may serve in the future; (3) competition
in the financial services industry; (4) our ability to implement our business strategy; (5) our ability to adapt to the rapid pace of
technological changes in the financial services industry; (6) the reliability, performance, functionality and quality of our products
and services and the investment performance of investment funds managed by third parties or by our asset managers; (7) the availability
of government authorizations on terms and conditions and within periods acceptable to us; (8) our ability to continue attracting and retaining
new appropriately-skilled employees; (9) our capitalization and level of indebtedness; (10) the interests of our controlling shareholders;
(11) changes in government regulations applicable to the financial services industry in Brazil and elsewhere; (12) our ability to compete
and conduct our business in the future; (13) the success of operating initiatives, including advertising and promotional efforts and new
product, service and concept development by us and our competitors; (14) changes in consumer demands regarding financial products, customer
experience related to investments and technological advances, and our ability to innovate to respond to such changes; (15) changes in
labor, distribution and other operating costs; (16) our compliance with, and changes to, government laws, regulations and tax matters
that currently apply to us; (17) other factors that may affect our financial condition, liquidity and results of operations. Accordingly,
you should not place undue reliance on forward-looking statements. The forward-looking statements included herein speak only as at the
date of this release and the Company does not undertake any obligation to update these forward-looking statements. Past performance does
not guarantee or predict future performance. Moreover, the Company and its affiliates, officers, employees and agents do not undertake
any obligation to review, update or confirm expectations or estimates or to release any revisions to any forward-looking statements to
reflect events that occur or circumstances that arise in relation to the content of the release. You are cautioned not to unduly rely
on such forward-looking statements when evaluating the information presented and we do not intend to update any of these forward-looking
statements.
Market data and industry information used throughout
this release are based on management’s knowledge of the industry and the good faith estimates of management. The Company also relied,
to the extent available, upon management’s review of industry surveys and publications and other publicly available information
prepared by a number of third-party sources. All of the market data and industry information used in this release involves a number of
assumptions and limitations, and you are cautioned not to give undue weight to such estimates. Although the Company believes that these
sources are reliable, there can be no assurance as to the accuracy or completeness of this information, and the Company has not independently
verified this information.
The contents hereof should not be construed as
investment, legal, tax or other advice and you should consult your own advisers as to legal, business, tax and other related matters concerning
an investment in the Company. The Company is not acting on your behalf and does not regard you as a customer or a client. It will not
be responsible to you for providing protections afforded to clients or for advising you on the relevant transaction.
This release includes our Float, Adjusted Gross
Financial Assets, Net Asset Value, and Adjustments to Reported Net Income, which are non-GAAP financial information. We believe that such
information is meaningful and useful in understanding the activities and business metrics of the Company’s operations. We also believe
that these non-GAAP financial measures reflect an additional way of viewing aspects of the Company’s business that, when viewed
with our International Financial Reporting Standards (“IFRS”) results, as issued by the International Accounting Standards
Board, provide a more complete understanding of factors and trends affecting the Company’s business. Further, investors regularly
rely on non-GAAP financial measures to assess operating performance and such measures may highlight trends in the Company’s business
that may not otherwise be apparent when relying on financial measures calculated in accordance with IFRS. We also believe that certain
non-GAAP financial measures are frequently used by securities analysts, investors and other interested parties in the evaluation of public
companies in the Company’s industry, many of which present these measures when reporting their results. The non-GAAP financial information
is presented for informational purposes and to enhance understanding of the IFRS financial statements. The non-GAAP measures should be
considered in addition to results prepared in accordance with IFRS, but not as a substitute for, or superior to, IFRS results. As other
companies may determine or calculate this non-GAAP financial information differently, the usefulness of these measures for comparative
purposes is limited. A reconciliation of such non-GAAP financial measures to the nearest GAAP measure is included in this release.
For purposes of this release:
“Active Clients” means the total number
of retail clients served through our XP Investimentos, Rico, Clear, XP Investments and XP Private (Europe) brands, with Client Assets
above R$100.00 or that have transacted at least once in the last thirty days. For purposes of calculating this metric, if a client holds
an account in more than one of the aforementioned entities, such client will be counted as one “active client” for each such
account. For example, if a client holds an account in each of XP Investimentos and Rico, such client will count as two “active clients”
for purposes of this metric.
“Client Assets” means the market value
of all client assets invested through XP’s platform and that is related to reported Retail Revenue, including equities, fixed income
securities, mutual funds (including those managed by XP Gestão de Recursos Ltda., XP Advisory Gestão de Recursos Ltda. and
XP Vista Asset Management Ltda., as well as by third-party asset managers), pension funds (including those from XP Vida e Previdência
S.A., as well as by third-party insurance companies), exchange traded funds, COEs (Structured Notes), REITs, and uninvested cash balances
(Float Balances), among others. Although Client Assets includes custody from Corporate Clients that generate Retail Revenue, it does not
include custody from institutional clients (asset managers, pension funds and insurance companies).
Rounding
We have made rounding adjustments to some of the
figures included in this release. Accordingly, numerical figures shown as totals in some tables may not be an arithmetic aggregation of
the figures that preceded them.
Unaudited Managerial Income Statement (in R$
mn)
| Managerial Income Statement |
3Q23 |
3Q22 |
YoY |
2Q23 |
QoQ |
| Total Gross Revenue |
4,364 |
3,811 |
14% |
3,728 |
17% |
| Retail |
3,179 |
2,629 |
21% |
2,892 |
10% |
| Equities |
1,131 |
1,120 |
1% |
1,064 |
6% |
| Fixed Income |
718 |
489 |
47% |
578 |
24% |
| Funds Platform |
323 |
282 |
15% |
341 |
-5% |
| Retirement Plans |
98 |
85 |
15% |
87 |
12% |
| Cards |
259 |
146 |
77% |
232 |
12% |
| Credit |
49 |
40 |
24% |
44 |
13% |
| Insurance |
36 |
21 |
72% |
36 |
1% |
| Other |
565 |
447 |
26% |
511 |
11% |
| Institutional |
386 |
577 |
-33% |
385 |
0% |
| Corporate & Issuer Services |
519 |
436 |
19% |
283 |
83% |
| Other |
281 |
170 |
65% |
167 |
68% |
| Net Revenue |
4,132 |
3,620 |
14% |
3,549 |
16% |
| COGS |
(1,236) |
(1,005) |
23% |
(1,147) |
8% |
| Gross Profit |
2,896 |
2,615 |
11% |
2,402 |
21% |
| Gross Margin |
70.1% |
72.2% |
-216 bps |
67.7% |
240 bps |
| SG&A |
(1,541) |
(1,463) |
5% |
(1,246) |
24% |
| People |
(1,048) |
(1,057) |
-1% |
(899) |
17% |
| Non-People |
(493) |
(405) |
22% |
(347) |
42% |
| D&A |
(71) |
(44) |
63% |
(51) |
40% |
| Interest expense on debt |
(135) |
(128) |
6% |
(152) |
-11% |
| Share of profit or (loss) in joint ventures and associates |
9 |
1 |
562% |
15 |
-63% |
| EBT |
1,157 |
983 |
18% |
968 |
20% |
| EBT Margin |
28.0% |
27.2% |
86 bps |
27.3% |
74 bps |
| Tax Expense (Accounting) |
(71) |
48 |
-248% |
9 |
-874% |
| Tax expense (Tax Withholding in Funds)6 |
(169) |
(212) |
-20% |
(168) |
1% |
| Effective tax rate (Normalized) |
(18.1%) |
(13.7%) |
-435 bps |
(14.0%) |
-410 bps |
| Net Income |
1,087 |
1,031 |
5% |
977 |
11% |
| Net Margin |
26.3% |
28.5% |
-218 bps |
27.5% |
-123 bps |
| Adjustments |
92 |
118 |
-22% |
85 |
8% |
| Adjusted Net Income7 |
1,179 |
1,149 |
3% |
1,062 |
11% |
| Adjusted Net Margin |
28.5% |
31.7% |
-321 bps |
29.9% |
-140 bps |
____________________
6 - Tax adjustments
are related to tax withholding expenses that are recognized net in gross revenue.
7 - See appendix
for a reconciliation of Adjusted Net Income.
Accounting Income Statement (in R$ mn)
| Accounting Income Statement |
3Q23 |
3Q22 |
YoY |
2Q23 |
QoQ |
| Net revenue from services rendered |
1,822 |
1,558 |
17% |
1,483 |
23% |
| Brokerage commission |
525 |
498 |
5% |
488 |
8% |
| Securities placement |
637 |
525 |
21% |
407 |
56% |
| Management fees |
414 |
361 |
15% |
419 |
-1% |
| Insurance brokerage fee |
43 |
35 |
24% |
42 |
3% |
| Commission Fees |
206 |
135 |
53% |
174 |
18% |
| Other services |
169 |
149 |
13% |
91 |
85% |
| Sales Tax and contributions on Services |
(173) |
(145) |
19% |
(139) |
25% |
| Net income from financial instruments at amortized cost and at fair value through other comprehensive income |
142 |
563 |
-75% |
618 |
-77% |
| Net income from financial instruments at fair value through profit or loss |
2,168 |
1,499 |
45% |
1,448 |
50% |
| Total revenue and income |
4,132 |
3,620 |
14% |
3,549 |
16% |
| Operating costs |
(1,122) |
(977) |
15% |
(1,092) |
3% |
| Selling expenses |
(50) |
(33) |
53% |
(45) |
10% |
| Administrative expenses |
(1,544) |
(1,503) |
3% |
(1,276) |
21% |
| Other operating revenues (expenses), net |
(18) |
29 |
n.a. |
24 |
-175% |
| Expected credit losses |
(115) |
(28) |
n.a. |
(55) |
109% |
| Interest expense on debt |
(135) |
(128) |
6% |
(152) |
-11% |
| Share of profit or (loss) in joint ventures and associates |
9 |
1 |
n.a. |
15 |
-38% |
| Income before income tax |
1,157 |
983 |
18% |
968 |
20% |
| Income tax expense |
(71) |
48 |
-248% |
9 |
n.a. |
| Net income for the period |
1,087 |
1,031 |
5% |
977 |
11% |
Balance Sheet (in R$ mn)
| Assets |
3Q23 |
2Q23 |
| Cash |
3,822 |
2,916 |
| Financial assets |
214,838 |
216,446 |
| Fair value through profit or loss |
120,854 |
124,465 |
| Securities |
101,039 |
99,280 |
| Derivative financial instruments |
19,815 |
25,185 |
| Fair value through other comprehensive income |
38,486 |
33,091 |
| Securities |
38,486 |
33,091 |
| Evaluated at amortized cost |
55,498 |
58,890 |
| Securities |
6,175 |
7,824 |
| Securities purchased under agreements to resell |
12,252 |
15,786 |
| Securities trading and intermediation |
3,569 |
2,917 |
| Accounts receivable |
620 |
646 |
| Loan Operations |
26,645 |
24,088 |
| Other financial assets |
6,236 |
7,630 |
| Other assets |
7,586 |
6,498 |
| Recoverable taxes |
302 |
220 |
| Rights-of-use assets |
204 |
209 |
| Prepaid expenses |
4,401 |
4,270 |
| Other |
2,679 |
1,800 |
| Deferred tax assets |
2,023 |
1,532 |
| Investments in associates and joint ventures |
2,261 |
2,250 |
| Property and equipment |
348 |
301 |
| Goodwill & Intangible assets |
2,551 |
837 |
| Total Assets |
233,427 |
230,781 |
| |
|
|
| Liabilities |
3Q23 |
2Q23 |
| Financial liabilities |
158,537 |
159,678 |
| Fair value through profit or loss |
32,888 |
40,800 |
| Securities |
14,342 |
14,554 |
| Derivative financial instruments |
18,546 |
26,247 |
| Evaluated at amortized cost |
125,649 |
118,877 |
| Securities sold under repurchase agreements |
39,517 |
34,623 |
| Securities trading and intermediation |
17,062 |
15,451 |
| Financing instruments payable |
53,094 |
51,931 |
| Accounts payables |
604 |
626 |
| Borrowings |
1,260 |
- |
| Other financial liabilities |
14,112 |
16,247 |
| Other liabilities |
54,793 |
52,520 |
| Social and statutory obligations |
711 |
947 |
| Taxes and social security obligations |
488 |
442 |
| Retirement plans liabilities |
53,280 |
50,907 |
| Provisions and contingent liabilities |
110 |
79 |
| Other |
204 |
146 |
| Deferred tax liabilities |
74 |
134 |
| Total Liabilities |
213,404 |
212,331 |
| Equity attributable to owners of the Parent company |
20,014 |
18,440 |
| Issued capital |
0 |
0 |
| Capital reserve |
18,745 |
16,523 |
| Other comprehensive income |
107 |
264 |
| Treasury |
(117) |
(117) |
| Retained earnings |
1,279 |
1,770 |
| Non-controlling interest |
9 |
9 |
| Total equity |
20,023 |
18,449 |
| Total liabilities and equity |
233,427 |
230,781 |
Float, Adjusted Gross Financial Assets and Net
Asset Value
(in R$ mn)
We present Adjusted Gross Financial Assets because
we believe this metric captures the liquidity that is, in fact, available to us, net of the portion of liquidity that is related to our
Float Balance (and therefore attributable to clients). We calculate Adjusted Gross Financial Assets as the sum of (1) Cash and Financial
Assets (comprised of Cash plus Securities – Fair value through profit or loss, plus Securities – Fair value through other
comprehensive income, plus Securities – Evaluated at amortized cost, plus Derivative financial instruments, plus Securities (purchased
under agreements to resell), plus Loans and Foreign exchange portfolio (assets) less (2) Financial Liabilities (comprised of the sum of
Securities loaned, Derivative financial instruments, Securities sold under repurchase agreements and Private pension liabilities), Deposits,
Structured Operation Certificates (COE), Financial Bills, Foreign exchange portfolio (liabilities), Credit cards operations and (3) less
Float Balance.
It is a measure that we track internally daily,
and it more intuitively reflects the effect of the operational profits we generate and the variations between working capital assets and
liabilities (cash flows from operating activities), investments in fixed and intangible assets and investments in the IFA Network (cash
flows from investing activities) and inflows and outflows related to equity and debt securities in our capital structure (cash flows from
financing activities). Our management treats all securities and financial instrument assets, net of financial instrument liabilities,
as balances that compose our total liquidity, with subline items (such as, for example, “securities at fair value through profit
and loss” and “securities at fair value through other comprehensive income”) expected to fluctuate substantially from
quarter to quarter as our treasury manages and allocates our total liquidity to the most suitable financial instruments.
In order to explain how we measure our cash position
or generation internally, we are introducing the Net Asset Value concept. Since we are a financial institution, we hold several types
of financial instruments with different characteristics, hence the definition of net cash that makes more sense from a business perspective
is the Net Asset Value. It is basically the adjusted gross financial assets net of debt instruments.
| Adjusted Gross Financial Assets |
3Q23 |
2Q23 |
| Assets |
216,300 |
216,881 |
| (+) Cash |
3,822 |
2,916 |
| (+) Securities - Fair value through profit or loss |
101,039 |
99,280 |
| (+) Securities - Fair value through other comprehensive income |
38,486 |
33,091 |
| (+) Securities - Evaluated at amortized cost |
6,175 |
7,824 |
| (+) Derivative financial instruments |
19,815 |
25,185 |
| (+) Securities purchased under agreements to resell |
12,252 |
15,786 |
| (+) Loans and credit card operations |
26,645 |
24,088 |
| (+) Foreign exchange portfolio |
4,240 |
5,556 |
| (+) Energy |
2,105 |
1,270 |
| (+) Central Bank Deposits |
1,722 |
1,885 |
| Liabilities |
(183,729) |
(185,632) |
| (-) Securities |
(14,342) |
(14,554) |
| (-) Derivative financial instruments |
(18,546) |
(26,247) |
| (-) Securities sold under repurchase agreements |
(39,517) |
(34,623) |
| (-) Retirement Plans Liabilities |
(53,280) |
(50,907) |
| (-) Deposits |
(22,635) |
(25,668) |
| (-) Structured Operations |
(16,241) |
(15,248) |
| (-) Financial Bills |
(7,812) |
(5,206) |
| (-) Foreign exchange portfolio |
(4,562) |
(6,007) |
| (-) Credit card operations |
(6,442) |
(5,899) |
| (-) Commitments subject to possible redemption |
- |
(1,090) |
| (-) Other Funding |
(352) |
(185) |
| (-) Float |
(13,493) |
(12,534) |
| (=) Adjusted Gross Financial Assets |
19,078 |
18,715 |
| Net Asset Value |
3Q23 |
2Q23 |
| (=) Adjusted Gross Financial Assets |
19,078 |
18,715 |
| Gross Debt |
(9,428) |
(7,946) |
| (-) Borrowings |
(1,260) |
- |
| (-) Debentures |
(2,656) |
(2,379) |
| (-) Structured financing |
(2,114) |
(2,321) |
| (-) Bonds |
(3,398) |
(3,246) |
| (=) Net Asset Value |
9,650 |
10,769 |
| Float (=net uninvested clients' deposits) |
3Q23 |
2Q23 |
| Assets |
(3,569) |
(2,917) |
| (-) Securities trading and intermediation |
(3,569) |
(2,917) |
| Liabilities |
17,062 |
15,451 |
| (+) Securities trading and intermediation |
17,062 |
15,451 |
| (=) Float |
13,493 |
12,534 |
Reconciliation
of Adjusted Net Income (in R$ mn)
| Adjusted Net Income |
3Q23 |
3Q22 |
YoY |
2Q23 |
QoQ |
| Net Income |
1,087 |
1,031 |
5% |
977 |
11% |
| (+) Share Based Compensation |
151 |
186 |
-19% |
140 |
8% |
| (+/-) Taxes |
(59) |
(68) |
-13% |
(55) |
7% |
| Adj. Net Income |
1,179 |
1,149 |
3% |
1,062 |
11% |
Exhibit 99.2

1 3Q23 Earnings Presentation
2 Important Disclosure IN REVIEWING THE INFORMATION CONTAINED IN THIS PRESENTATION, YOU ARE AGREEING TO ABIDE BY THE TERMS OF THIS DISCLAIMER . THIS INFORMATION IS BEING MADE AVAILABLE TO EACH RECIPIENT SOLELY FOR ITS INFORMATION AND IS SUBJECT TO AMENDMENT . This presentation is prepared by XP Inc . (the “Company,” “we” or “our”), is solely for informational purposes . This presentation does not constitute a prospectus and does not constitute an offer to sell or the solicitation of an offer to buy any securities . In addition, this document and any materials distributed in connection with this presentation are not directed to, or intended for distribution to or use by, any person or entity that is a citizen or resident or located in any locality, state, country or other jurisdiction where such distribution, publication, availability or use would be contrary to law or regulation or which would require any registration or licensing within such jurisdiction . This presentation was prepared by the Company . Neither the Company nor any of its affiliates, officers, employees or agents, make any representation or warranty, express or implied, in relation to the fairness, reasonableness, adequacy, accuracy or completeness of the information, statements or opinions, whichever their source, contained in this presentation or any oral information provided in connection herewith, or any data it generates and accept no responsibility, obligation or liability (whether direct or indirect, in contract, tort or otherwise) in relation to any of such information . The information and opinions contained in this presentation are provided as at the date of this presentation, are subject to change without notice and do not purport to contain all information that may be required to evaluate the Company . The information in this presentation is in draft form and has not been independently verified . The Company and its affiliates, officers, employees and agents expressly disclaim any and all liability which may be based on this presentation and any errors therein or omissions therefrom . Neither the Company nor any of its affiliates, officers, employees or agents makes any representation or warranty, express or implied, as to the achievement or reasonableness of future projections, management targets, estimates, prospects or returns, if any . The information contained in this presentation does not purport to be comprehensive and has not been subject to any independent audit or review . Certain of the financial information as of and for the periods ended December 31 , 2019 , 2018 and 2017 has been derived from audited financial statements and all other financial information has been derived from unaudited interim financial statements . A significant portion of the information contained in this presentation is based on estimates or expectations of the Company, and there can be no assurance that these estimates or expectations are or will prove to be accurate . The Company’s internal estimates have not been verified by an external expert, and the Company cannot guarantee that a third party using different methods to assemble, analyze or compute market information and data would obtain or generate the same results . Statements in the presentation, including those regarding the possible or assumed future or other performance of the Company or its industry or other trend projections, constitute forward - looking statements . These statements are generally identified by the use of words such as “anticipate,” “believe,” “could,” “expect,” “should,” “plan,” “intend,” “estimate” and “potential,” among others . By their nature, forward - looking statements are necessarily subject to a high degree of uncertainty and involve known and unknown risks, uncertainties, assumptions and other factors because they relate to events and depend on circumstances that will occur in the future whether or not outside the control of the Company . Such factors may cause actual results, performance or developments to differ materially from those expressed or implied by such forward - looking statements and there can be no assurance that such forward - looking statements will prove to be correct . These risks and uncertainties include factors relating to : ( 1 ) general economic, financial, political, demographic and business conditions in Brazil, as well as any other countries we may serve in the future and their impact on our business ; ( 2 ) fluctuations in interest, inflation and exchange rates in Brazil and any other countries we may serve in the future ; ( 3 ) competition in the financial services industry ; ( 4 ) our ability to implement our business strategy ; ( 5 ) our ability to adapt to the rapid pace of technological changes in the financial services industry ; ( 6 ) the reliability, performance, functionality and quality of our products and services and the investment performance of investment funds managed by third parties or by our asset managers ; ( 7 ) the availability of government authorizations on terms and conditions and within periods acceptable to us ; ( 8 ) our ability to continue attracting and retaining new appropriately - skilled employees ; ( 9 ) our capitalization and level of indebtedness ; ( 10 ) the interests of our controlling shareholders ; ( 11 ) changes in government regulations applicable to the financial services industry in Brazil and elsewhere ; ( 12 ) our ability to compete and conduct our business in the future ; ( 13 ) the success of operating initiatives, including advertising and promotional efforts and new product, service and concept development by us and our competitors ; ( 14 ) changes in consumer demands regarding financial products, customer experience related to investments and technological advances, and our ability to innovate to respond to such changes ; ( 15 ) changes in labor, distribution and other operating costs ; ( 16 ) our compliance with, and changes to, government laws, regulations and tax matters that currently apply to us ; ( 17 ) the negative impacts of the COVID - 19 pandemic on global, regional and national economies and the related market volatility and protracted economic downturn ; and ( 18 ) other factors that may affect our financial condition, liquidity and results of operations . Accordingly, you should not place undue reliance on forward - looking statements . The forward - looking statements included herein speak only as at the date of this presentation and the Company does not undertake any obligation to update these forward - looking statements . Past performance does not guarantee or predict future performance . Moreover, the Company and its affiliates, officers, employees and agents do not undertake any obligation to review, update or confirm expectations or estimates or to release any revisions to any forward - looking statements to reflect events that occur or circumstances that arise in relation to the content of the presentation . You are cautioned not to unduly rely on such forward - looking statements when evaluating the information presented and we do not intend to update any of these forward - looking statements . Market data and industry information used throughout this presentation are based on management’s knowledge of the industry and the good faith estimates of management . The Company also relied, to the extent available, upon management’s review of industry surveys and publications and other publicly available information prepared by a number of third party sources . All of the market data and industry information used in this presentation involves a number of assumptions and limitations, and you are cautioned not to give undue weight to such estimates . Although the Company believes that these sources are reliable, there can be no assurance as to the accuracy or completeness of this information, and the Company has not independently verified this information . The contents hereof should not be construed as investment, legal, tax or other advice and you should consult your own advisers as to legal, business, tax and other related matters concerning an investment in the Company . The Company is not acting on your behalf and does not regard you as a customer or a client . It will not be responsible to you for providing protections afforded to clients or for advising you on the relevant transaction . This presentation also includes certain non - GAAP financial information . We believe that such information is meaningful and useful in understanding the activities and business metrics of the Company’s operations . We also believe that these non - GAAP financial measures reflect an additional way of viewing aspects of the Company’s business that, when viewed with our International Financial Reporting Standards (“IFRS”) results, as issued by the International Accounting Standards Board, provide a more complete understanding of factors and trends affecting the Company’s business . Further, investors regularly rely on non - GAAP financial measures to assess operating performance and such measures may highlight trends in the Company’s business that may not otherwise be apparent when relying on financial measures calculated in accordance with IFRS . We also believe that certain non - GAAP financial measures are frequently used by securities analysts, investors and other interested parties in the evaluation of public companies in the Company’s industry, many of which present these measures when reporting their results . The non - GAAP financial information is presented for informational purposes and to enhance understanding of the IFRS financial statements . The non - GAAP measures should be considered in addition to results prepared in accordance with IFRS, but not as a substitute for, or superior to, IFRS results . As other companies may determine or calculate this non - GAAP financial information differently, the usefulness of these measures for comparative purposes is limited . A reconciliation of such non - GAAP financial measures to the nearest GAAP measure is included in this presentation . For purposes of this presentation : “Active Clients” means the total number of retail clients served through our XP Investimentos, Rico, Clear, XP Investments and XP Private (Europe) brands, with Client Assets above R $ 100 . 00 or that have transacted at least once in the last thirty days . For purposes of calculating this metric, if a client holds an account in more than one of the aforementioned entities, such client will be counted as one “active client” for each such account . For example, if a client holds an account in each of XP Investimentos and Rico, such client will count as two “active clients” for purposes of this metric . “Client Assets” means the market value of all client assets invested through XP’s platform, including equities, fixed income securities, mutual funds (including those managed by XP Gestão de Recursos Ltda . , XP Advisory Gestão Recursos Ltda . and XP Vista Asset Management Ltda . , as well as by third - party asset managers), pension funds (including those from XP Vida e Previdência S . A . , as well as by third - party insurance companies), exchange traded funds, COEs (Structured Notes), REITs, and uninvested cash balances (Floating Balances), among others .

3 Index 3Q23 Financials 02 Q&A 03 01 Key Highlights A ppendix 04

1 Key Highlights
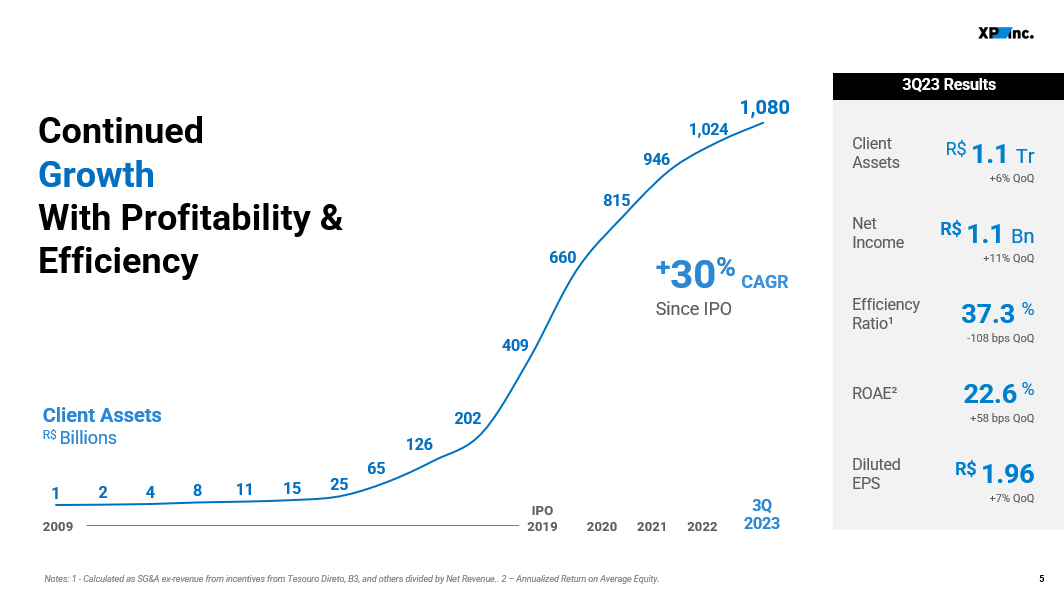
5 1 2 4 8 11 15 25 65 126 202 409 660 815 946 1,024 1,080 Notes: 1 - Calculated as SG&A ex - revenue from incentives from Tesouro Direto , B3, and others divided by Net Revenue. . 2 – Annualized Return on Average Equity. IPO 2019 2022 2021 2020 3Q 2023 2009 Client Assets R$ Billions Continued Growth With Profitability & Efficiency + 30 % CAGR Since IPO 3Q23 Results R$ 1.1 Bn Net Income +11% QoQ R$ 1.1 Tr Client Assets +6% QoQ 22.6 % ROAE² +58 bps QoQ R$ 1.96 Diluted EPS +7% QoQ 37.3 % Efficiency Ratio¹ - 108 bps QoQ
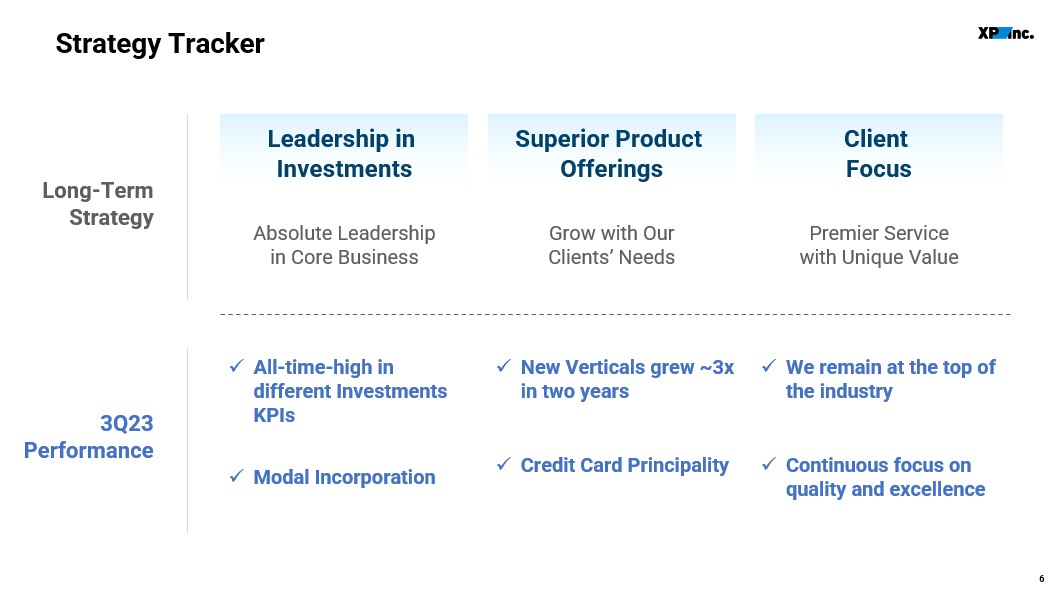
6 Strategy Tracker Leadership in Investments Superior Product Offerings Client Focus Absolute Leadership in Core Business Grow with Our Clients’ Needs Premier Service with Unique Value Long - Term Strategy 3Q23 Performance x All - time - high in different Investments KPIs x Modal Incorporation x New Verticals grew ~3x in two years x Credit Card Principality x We remain at the top of the industry x Continuous focus on quality and excellence
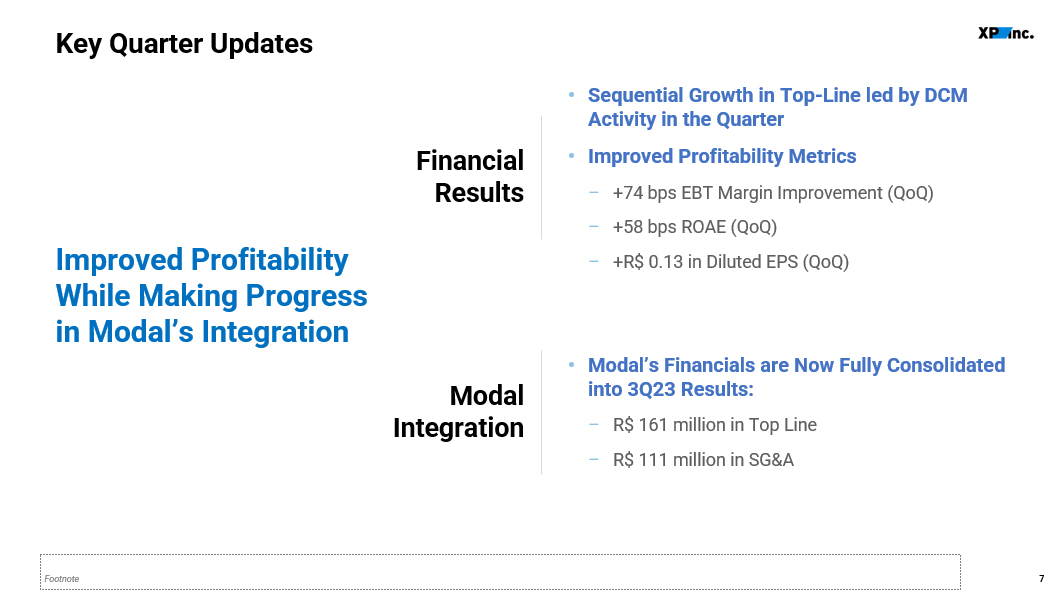
7 Improved Profitability While Making Progress in Modal’s Integration Key Quarter Updates F inancial Results • Sequential Growth in Top - Line led by DCM Activity in the Quarter • Improved Profitability Metrics – +74 bps EBT Margin Improvement ( QoQ ) – +58 bps ROAE ( QoQ ) – +R$ 0.13 in Diluted EPS ( QoQ ) Modal Integration • Modal’s Financials are Now Fully Consolidated into 3Q23 Results: – R$ 161 million in Top Line – R$ 111 million in SG&A

2 3Q23 Financials
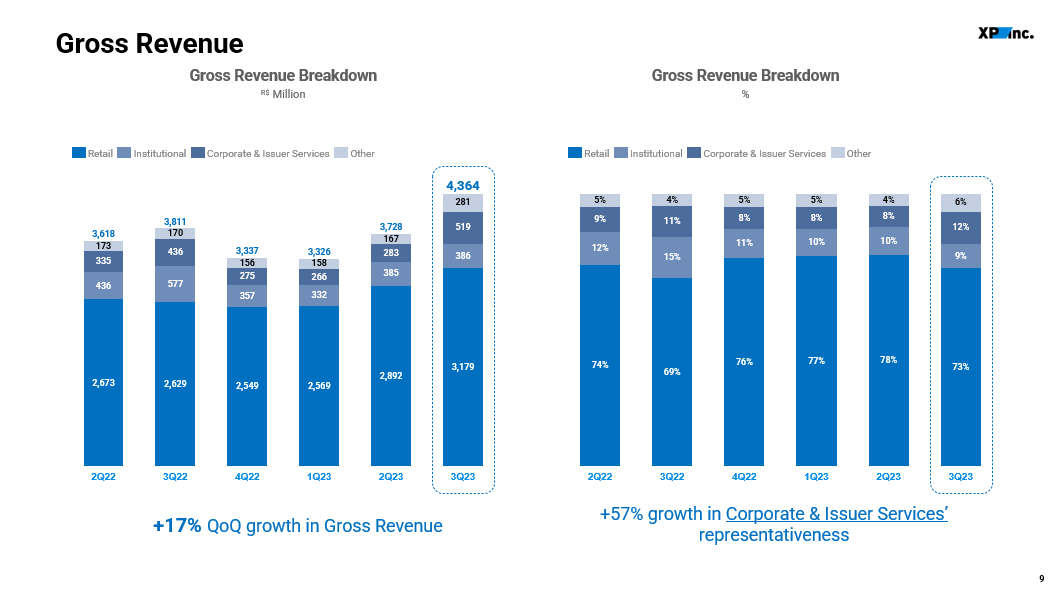
9 Gross Revenue 2,673 2,629 2,549 2,569 2,892 3,179 436 577 357 332 385 386 335 436 275 266 283 519 173 170 156 158 167 281 2Q22 3Q22 4Q22 1Q23 2Q23 3Q23 3,618 3,811 3,337 3,326 3,728 4,364 Retail Institutional Corporate & Issuer Services Other 74% 69% 76% 77% 78% 73% 12% 15% 11% 10% 10% 9% 9% 11% 8% 8% 8% 12% 5% 4% 5% 5% 4% 6% 2Q22 3Q22 4Q22 1Q23 2Q23 3Q23 Retail Institutional Corporate & Issuer Services Other +17% QoQ growth in Gross Revenue +57% growth in Corporate & Issuer Services’ representativeness Gross Revenue Breakdown % Gross Revenue Breakdown R$ Million
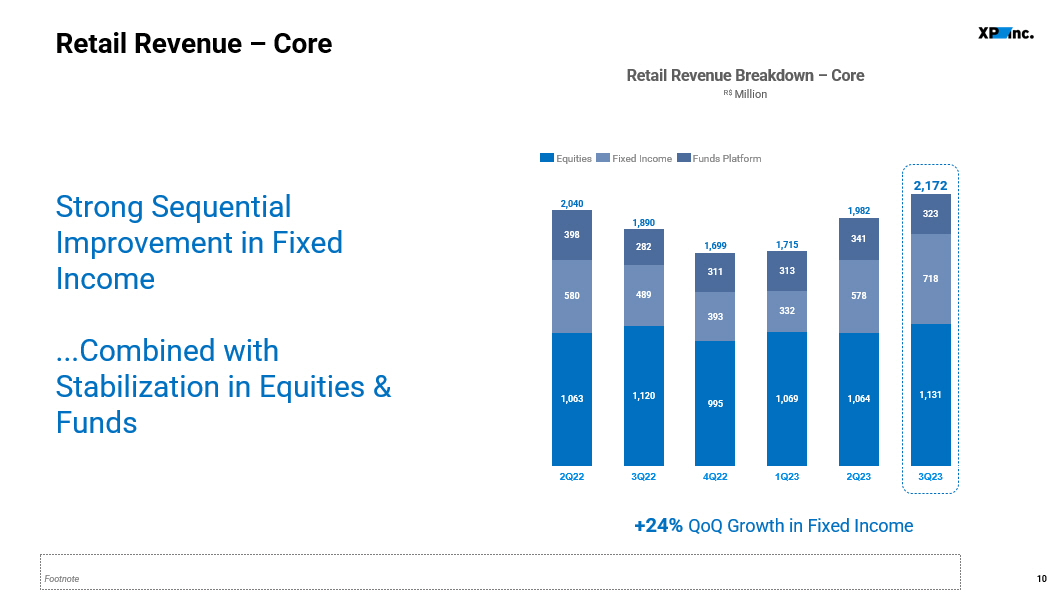
10 Retail Revenue – Core Strong Sequential Improvement in Fixed Income ...Combined with Stabilization in Equities & Funds 1,063 1,120 995 1,069 1,064 1,131 580 489 393 332 578 718 398 282 311 313 341 323 2Q22 3Q22 4Q22 1Q23 2Q23 3Q23 2,040 1,890 1,699 1,715 1,982 2,172 Equities Fixed Income Funds Platform +24% QoQ Growth in Fixed Income Retail Revenue Breakdown – Core R$ Million
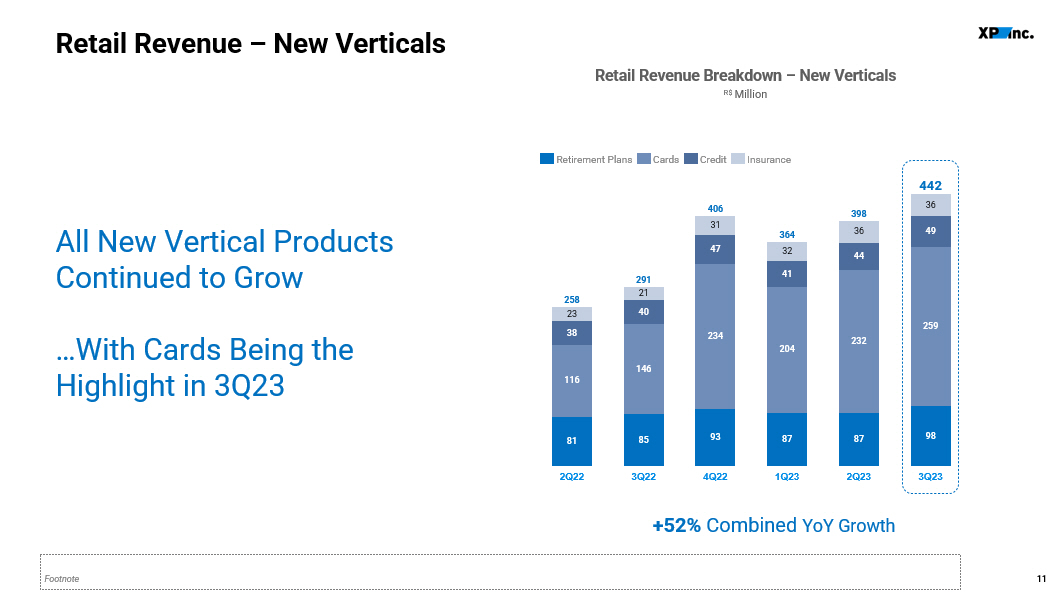
11 Retail Revenue – New Verticals All New Vertical Products Continued to Grow …With Cards Being the Highlight in 3Q23 81 85 93 87 87 98 116 146 234 204 232 259 38 40 47 41 44 49 23 21 31 32 36 36 2Q22 3Q22 4Q22 1Q23 2Q23 3Q23 258 291 406 364 398 442 Retirement Plans Cards Credit Insurance +52% Combined YoY Growth Retail Revenue Breakdown – New Verticals R$ Million
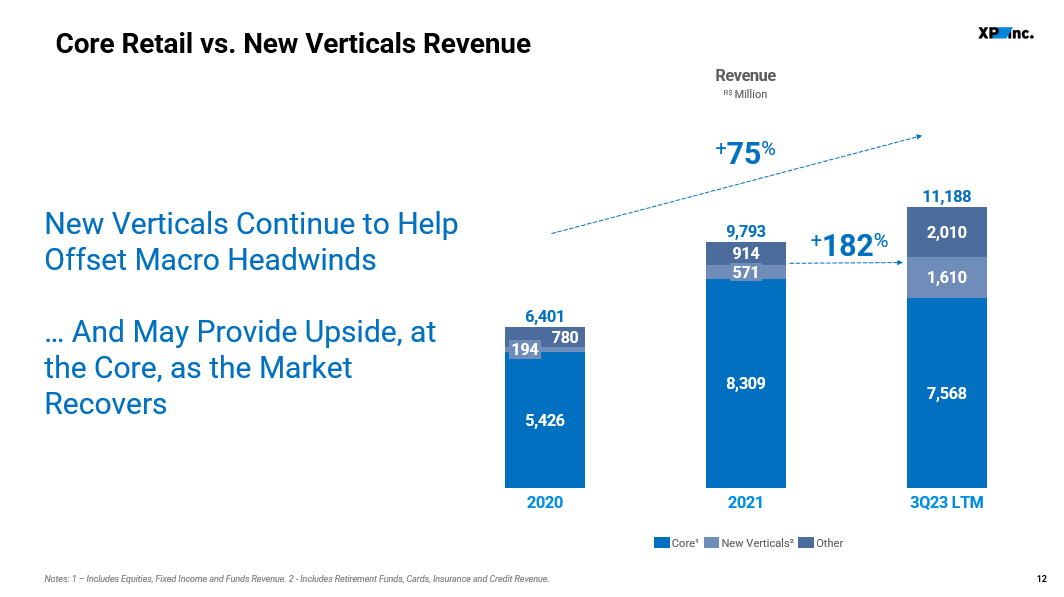
12 Core Retail vs. New Verticals Revenue Notes: 1 – Includes Equities, Fixed Income and Funds Revenue. 2 - Includes Retirement Funds, Cards, Insurance and Credit Revenue . + 75 % New Verticals Continue to Help Offset Macro Headwinds … And May Provide Upside, at the Core, as the Market Recovers 5,426 8,309 7,568 1,610 780 914 2,010 194 2020 571 2021 3Q23 LTM 6,401 9,793 11,188 Revenue R$ Million + 182 % Core¹ New Verticals² Other
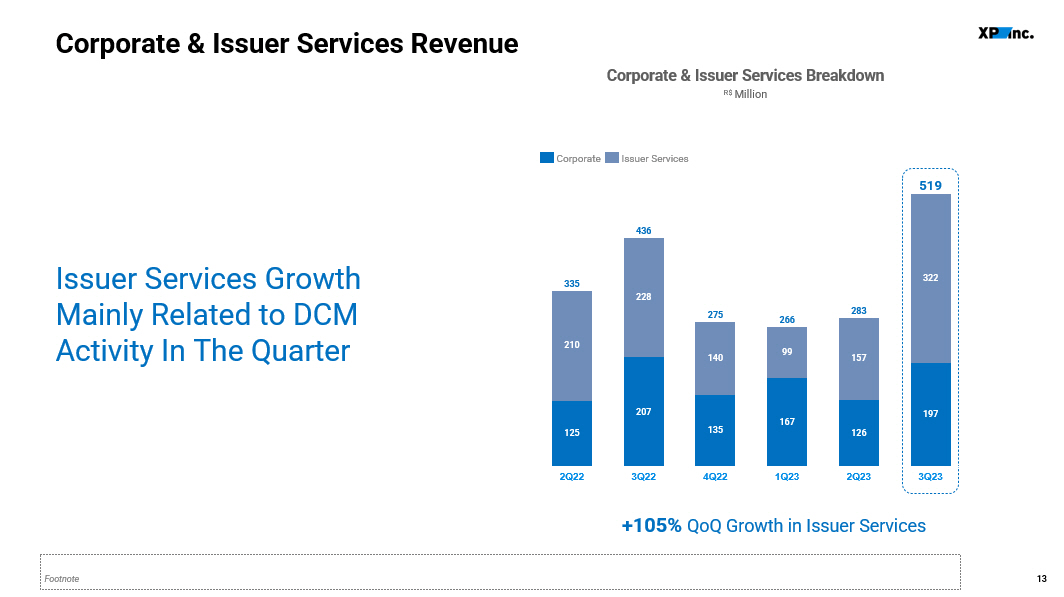
13 Corporate & Issuer Services Revenue Issuer Services Growth Mainly Related to DCM Activity In The Quarter 125 207 135 167 126 197 210 228 140 99 157 322 2Q22 3Q22 4Q22 1Q23 2Q23 3Q23 335 436 275 266 283 519 Corporate Issuer Services +105% QoQ Growth in Issuer Services Corporate & Issuer Services Breakdown R$ Million
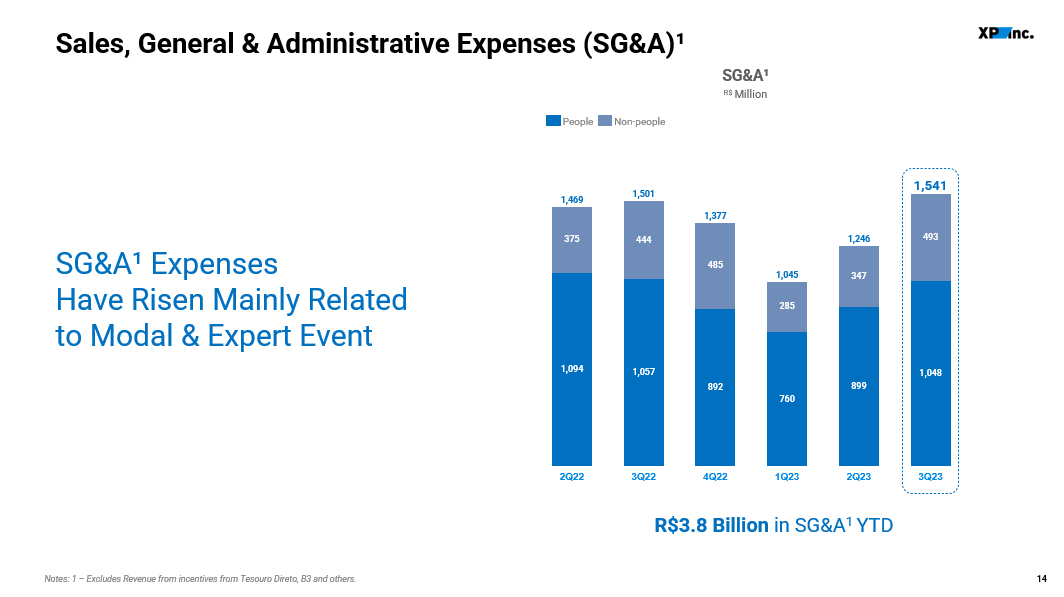
14 Sales, General & Administrative Expenses (SG&A)¹ Notes: 1 – Excludes Revenue from incentives from Tesouro Direto , B3 and others. 1,094 1,057 892 760 899 1,048 375 444 485 285 347 493 2Q22 3Q22 4Q22 1Q23 2Q23 3Q23 1,469 1,501 1,377 1,045 1,246 1,541 People Non - people R$3.8 Billion in SG&A 1 YTD SG&A¹ Expenses Have Risen Mainly Related to Modal & Expert Event SG&A¹ R$ Million

15 Efficiency & Compensation Ratios Notes: 1 – Calculated as SG&A ex - revenue from incentives from Tesouro Direto , B3, and others divided by Net Revenue. 2 – Calculated as People SG&A (Salary and Taxes, Bonuses and Share Based Compensation) divided by Net Revenue Compensation Ratio 2 LTM % Efficiency Ratio 1 LTM % 38.4% 41.7% 40.4% 38.3% 37.3% 3Q21 4Q21 1Q22 2Q22 3Q22 4Q22 1Q23 2Q23 3Q23 27.9% 29.8% 28.5% 26.8% 25.7% 3Q21 4Q21 1Q22 2Q22 3Q22 4Q22 1Q23 2Q23 3Q23 We Remain Disciplined in Our Cost Controls … With Both Our Efficiency & Compensation Ratios Continuing to Fall Steeply
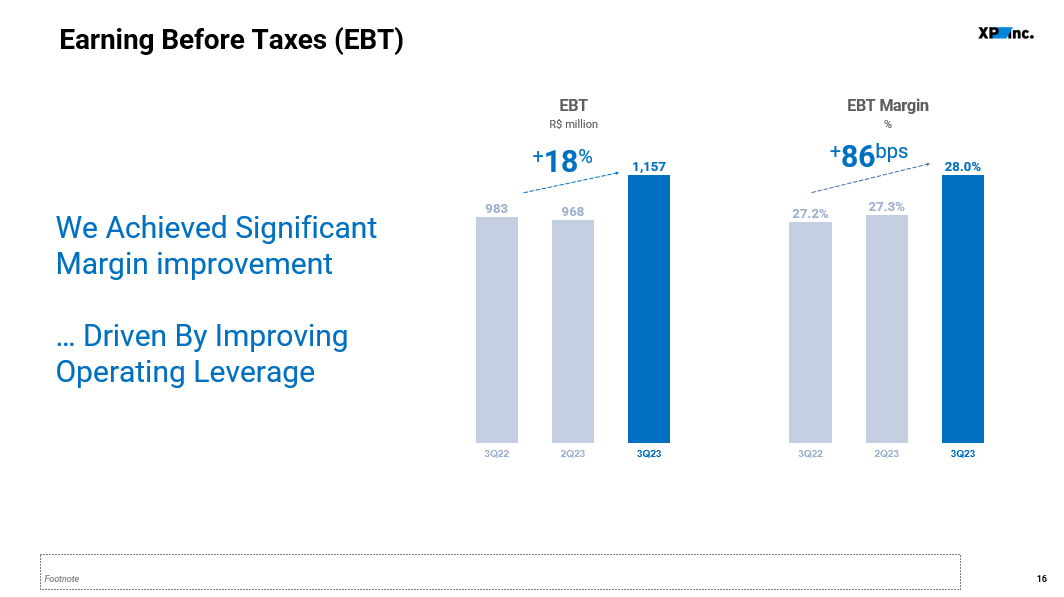
16 Earning Before Taxes (EBT) + 18 % + 86 bps 983 968 1,157 3Q22 2Q23 3Q23 EBT Margin % 27.2% 27.3% 28.0% 3Q22 2Q23 3Q23 EBT R$ million We Achieved Significant Margin improvement … Driven By Improving Operating Leverage
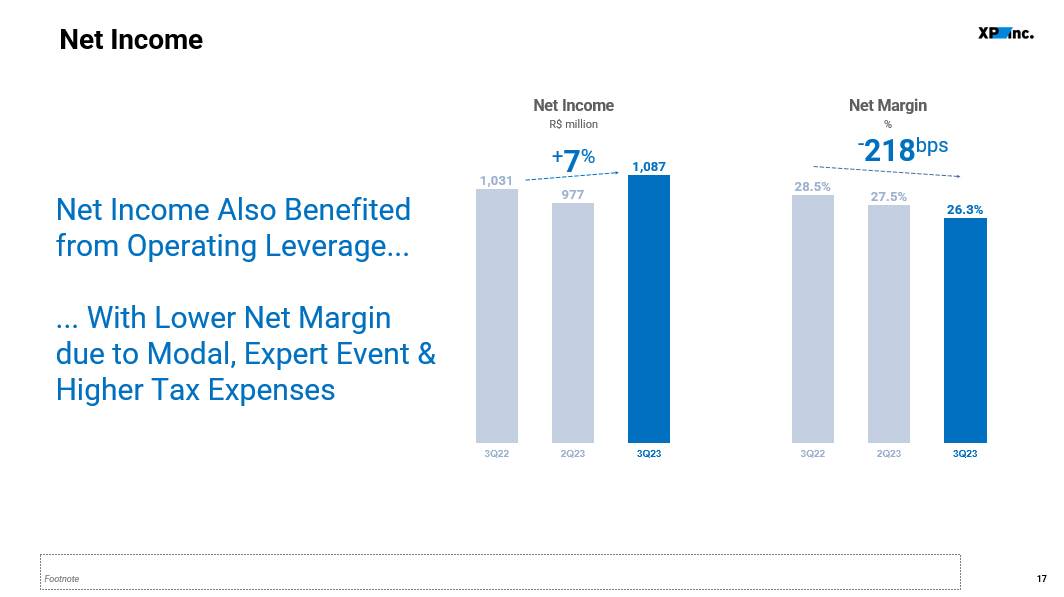
17 Net Income + 7 % - 218 bps 1,031 977 1,087 3Q22 2Q23 3Q23 Net Margin % Net Income R$ million 28.5% 27.5% 26.3% 3Q22 2Q23 3Q23 Net Income Also Benefited from Operating Leverage... ... With Lower Net Margin due to Modal, Expert Event & Higher Tax Expenses
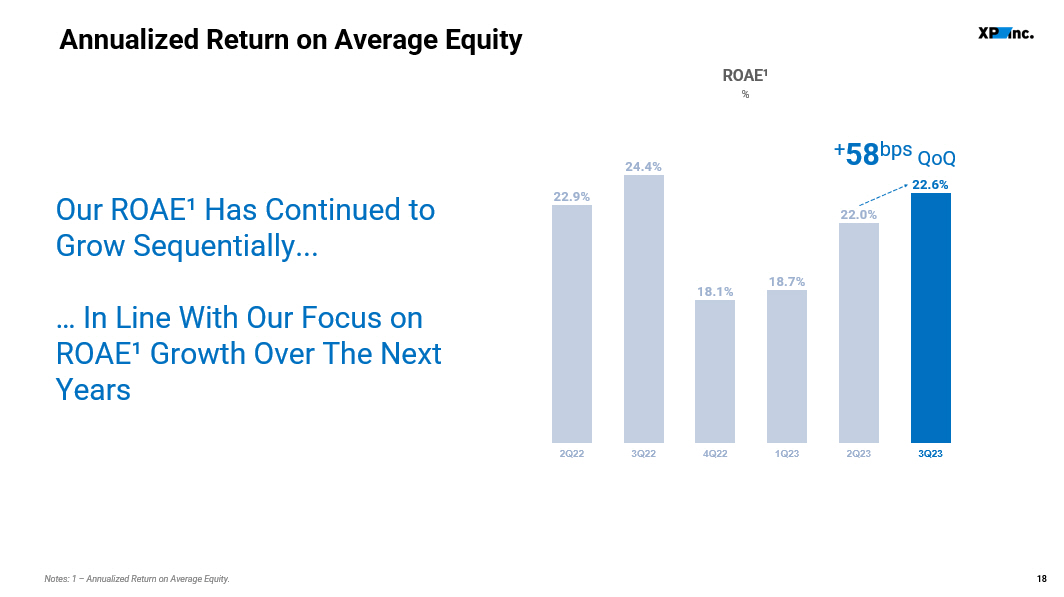
18 Annualized Return on Average Equity + 58 bps QoQ 22.9% 24.4% 18.1% 18.7% 22.0% 2Q22 3Q22 4Q22 1Q23 2Q23 3Q23 22.6% Notes: 1 – Annualized Return on Average Equity. Our ROAE¹ Has Continued to Grow Sequentially... … In Line With Our Focus on ROAE¹ Growth Over The Next Years ROAE¹ %

3 Q&A

4 Appendix
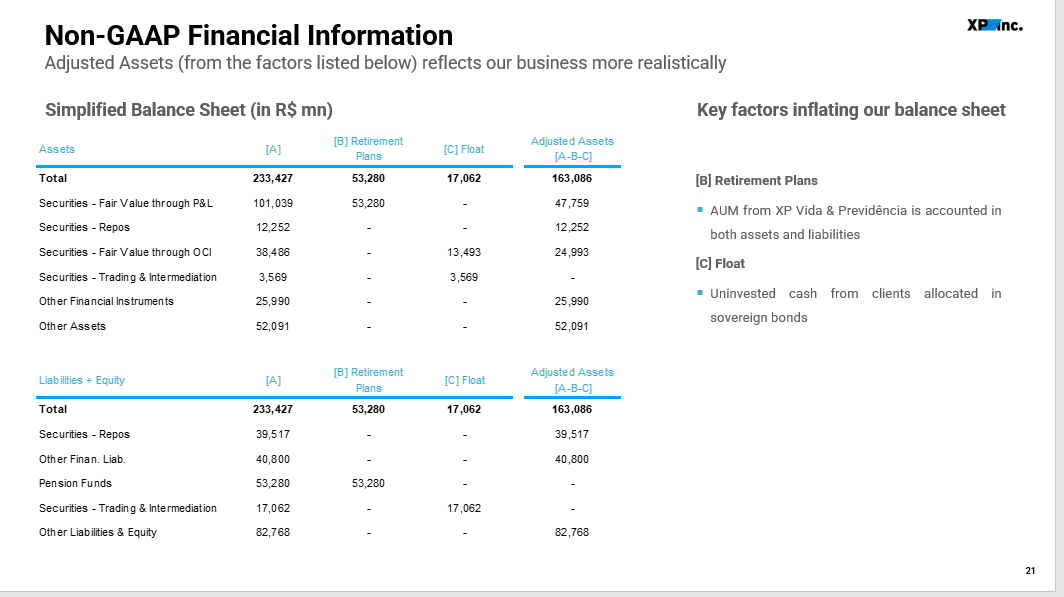
21 Non - GAAP Financial Information Adjusted Assets (from the factors listed below) reflects our business more realistically [B] Retirement Plans ▪ AUM from XP Vida & Previdência is accounted in both assets and liabilities [C] Float ▪ Uninvested cash from clients allocated in sovereign bonds Key factors inflating our balance sheet Simplified Balance Sheet (in R $ mn) Assets [A] [B] Retirement Plans [C] Float Adjusted Assets [A-B-C] Total 233,427 53,280 17,062 163,086 Securities - Fair Value through P&L 101,039 53,280 - 47,759 Securities - Repos 12,252 - - 12,252 Securities - Fair Value through OCI 38,486 - 13,493 24,993 Securities - Trading & Intermediation 3,569 - 3,569 - Other Financial Instruments 25,990 - - 25,990 Other Assets 52,091 - - 52,091 Liabilities + Equity [A] [B] Retirement Plans [C] Float Adjusted Assets [A-B-C] Total 233,427 53,280 17,062 163,086 Securities - Repos 39,517 - - 39,517 Other Finan. Liab. 40,800 - - 40,800 Pension Funds 53,280 53,280 - - Securities - Trading & Intermediation 17,062 - 17,062 - Other Liabilities & Equity 82,768 - - 82,768
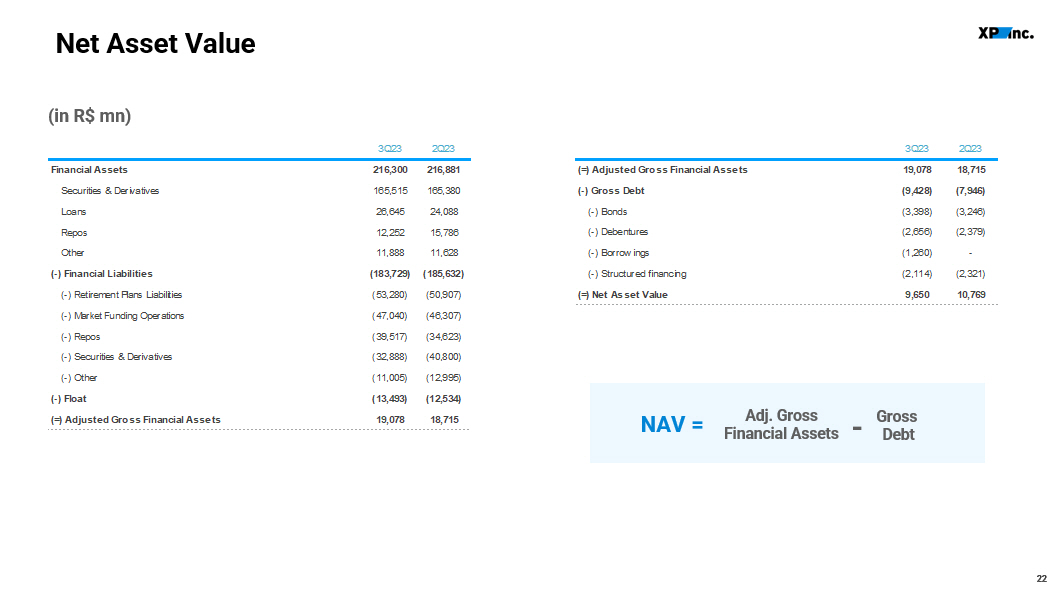
22 Net Asset Value 22 (in R $ mn ) Adj. Gross Financial Assets NAV = Gross Debt - 3Q23 2Q23 Financial Assets 216,300 216,881 Securities & Derivatives 165,515 165,380 Loans 26,645 24,088 Repos 12,252 15,786 Other 11,888 11,628 (-) Financial Liabilities (183,729) (185,632) (-) Retirement Plans Liabilities (53,280) (50,907) (-) Market Funding Operations (47,040) (46,307) (-) Repos (39,517) (34,623) (-) Securities & Derivatives (32,888) (40,800) (-) Other (11,005) (12,995) (-) Float (13,493) (12,534) (=) Adjusted Gross Financial Assets 19,078 18,715

23 Investor Relations ir@xpi.com.br https://investors.xpinc.com/
XP (NASDAQ:XP)
Historical Stock Chart
From Jun 2024 to Jul 2024

XP (NASDAQ:XP)
Historical Stock Chart
From Jul 2023 to Jul 2024
