UNITED STATES SECURITIES AND EXCHANGE COMMISSION
Washington, D.C. 20549
FORM 6-K
REPORT OF FOREIGN PRIVATE ISSUER
PURSUANT TO RULE 13a-16 OR 15d-16 UNDER
THE SECURITIES EXCHANGE ACT OF 1934
For the month of May, 2024
Commission File Number: 001-38049
Azul S.A.
(Name of Registrant)
Edifício Jatobá, 8th floor, Castelo Branco Office Park
Avenida Marcos Penteado de Ulhôa Rodrigues, 939
Tamboré, Barueri, São Paulo, SP 06460-040, Brazil.
+55 (11) 4831 2880
(Address of Principal Executive Office)
Indicate by check mark whether the registrant files or will file annual reports under cover of Form 20-F or Form 40-F.
Form 20-F x Form 40-F ¨
Indicate by check mark if the registrant is submitting the Form 6-K in paper as permitted by Regulation S-T Rule 101(b)(1):
Yes ¨ No x
Indicate by check mark if the registrant is submitting the Form 6-K in paper as permitted by Regulation S-T Rule 101(b)(7):
Yes ¨ No x
 |
First Quarter
Results
2024
|
| |
|
Azul Reports Record
1Q Results with EBITDA margin of 30.3%
São Paulo, May 13, 2024 –
Azul S.A., “Azul” (B3:AZUL4, NYSE:AZUL), the largest airline in Brazil by number of cities and departures, announces today
its results for the first quarter of 2024 (“1Q24”). The following financial information, unless stated otherwise, is presented
in Brazilian reais and in accordance with International Financial Reporting Standards (IFRS).
Financial and Operating Highlights
| § | | EBITDA reached an
all-time record for a first quarter, increasing 37.4% to R$1.4 billion, with a margin of 30.3%. This represents an increase of R$385.2
million compared to 1Q23. |
| § | | Operating income
was also at record levels for a first quarter, increasing an impressive 73.2% to R$800.7 million, representing a margin of 17.1%, 6.8
percentage points higher than in 1Q23. |
| § | | Operating revenue
also reached a first quarter record, increasing 4.5% to R$4.7 billion, driven by a healthy demand environment, robust ancillary revenues,
and growth in our other business units. |
| § | | PRASK and RASK were
also at record levels for a first quarter at R$39.33 cents and R$42.23 cents, respectively, an increase of 1.9% and 1.8% versus 1Q23,
while at the same time capacity increased 2.6%. |
| § | | Yield reached a
record for a first quarter at R$49.84 cents, an increase of 2.8% compared to 1Q23. |
| § | | Passenger traffic
(RPK) increased 1.7% over a capacity increase of 2.6%, resulting in a load factor of 79%. |
| 1Q24 Highlights |
1Q24 |
1Q23¹ |
Change |
| Total operating revenue (R$ million) |
4,678.4 |
4,478.3 |
4.5% |
| Operating income (R$ million) |
800.7 |
462.4 |
338.3 |
| Operating margin (%) |
17.1% |
10.3% |
+6.8 p.p. |
| EBITDA (R$ million) |
1,415.2 |
1,030.1 |
385.2 |
| EBITDA margin (%) |
30.3% |
23.0% |
+7.2 p.p. |
| ASK (million) |
11,077 |
10,799 |
2.6% |
| RASK (R$ cents) |
42.23 |
41.47 |
1.8% |
| PRASK (R$ cents) |
39.33 |
38.61 |
1.9% |
| Yield (R$ cents) |
49.84 |
48.50 |
2.8% |
| CASK (R$ cents) |
35.01 |
37.19 |
-5.9% |
| Fuel cost per liter (R$) |
4.25 |
5.25 |
-19.1% |
¹ 1Q23 operating results were adjusted for non-recurring
items.
| § | | CASK in 1Q24 was
R$35.01 cents, a reduction of 5.9% compared to 1Q23, mainly driven by a 19.1% reduction in fuel prices, partially offset by the 3.9%
inflation over the last 12 months and investments to support our upcoming growth and maximize fleet availability. |
| § | | Fuel consumption
per ASK dropped 2.6% in 1Q24 versus 1Q23, as a result of the higher number of next-generation aircraft in our fleet. |
| § | | Immediate liquidity
was R$2.7 billion, 50.8% higher compared to 1Q23, representing 14.4% of the last twelve months’ revenues. In the quarter, we continued
to deleverage and paid down over R$1.8 billion in debt amortization, interest, and deferrals. |
| § | | Leverage, measured as net debt to LTM EBITDA, reached 3.7x, a remarkable reduction
of 1.4x compared to 1Q23. Azul expects to continue reducing leverage, reaching approximately 3.0x at the end of 2024, below pre-pandemic
levels. |
| | First Quarter Results 2024 |
| | |
Management Comments
First, I wish to express solidarity with the
people of Rio Grande do Sul during this very difficult time. We are deeply saddened by the loss of lives, the displacement of people,
and the widespread destruction caused by severe flooding in that region. At this moment, we have already collected more than 1,000 tons
of items and are working on distributing them. Thousands of Crewmembers from all over the country have donated time, money, and supplies
to the relief effort, while continuing to offer the Azul experience with excellence every day. I have always stated that we have the best
Crewmembers in the world, and they are once again proving it. I cannot thank them enough for their passion and dedication.
Focusing now on our 1Q24 results, I am happy
to report that we had another record quarter. Our operating revenue increased 4.5% to R$4.7 billion, driven by a healthy domestic
and international demand environment, robust ancillary revenues, and growth in our business units. RASK and PRASK stood at record levels
for a first quarter at R$42.23 cents and R$39.33 cents, respectively, demonstrating the strength of our business model. Capacity
for the quarter grew 2.6%, supported by 6% growth in the domestic market offset by a temporary reduction in our international network
due to a transition in our widebody fleet. We are especially encouraged by the progress we are making in aircraft utilization, reaching
11.5 hours, a 17% increase over 1Q23, and with room for further improvement.
Our business units continued their growth
trajectories. Our loyalty program Azul Fidelidade is now at 17 million members, with active users also at all-time highs. Gross billings
for the program increased 31% versus 1Q23, with a 32% increase in the fair value of our points. Our vacations business Azul Viagens increased
gross bookings 75% year-over-year thanks to the strong demand in leisure markets supported by our dedicated vacations network. Finally,
our cargo business remained strong, in the opposite direction of global trends, and together with other revenues increased 4.2% versus
last year.
EBITDA reached R$1.4 billion, a historical
record for a first quarter and an increase of 37.4% compared to 1Q23. Our EBITDA margin of 30.3% was also a first quarter record and one
of the highest in the world. This clearly confirms our ability to grow and expand margins at the same time.
During the quarter, CASK decreased 5.9% year-over-year.
One of the drivers of this improvement was a 2.6% decrease in fuel consumption per ASK, as a result of the higher number of next-generation
aircraft in our fleet. We have the lowest CASK among our competitors, even with a smaller average aircraft size.
We ended the quarter with a solid liquidity
position of R$2.7 billion, representing 14% of our last twelve months’ revenue. Including long-term investments and receivables,
security deposits and reserves, our total liquidity was R$6.0 billion. Our leverage reached 3.7x in 1Q24, an impressive reduction
of 1.4x in one year, and we expect to continue our deleveraging process, reaching approximately 3.0x at the end of 2024, below pre-pandemic
levels. This reflects our solid capital structure, in addition to our continued focus on cost efficiency and productivity.
We continue to be 100% focused on increasing
the profitability of our business, and with our continued fleet transformation, increased aircraft utilization and other initiatives,
we will end this year as a much larger and more profitable airline. Between now and 1Q25, we will receive 13 new Embraer E2s, which deliver
18% lower fuel burn compared to the E1 with 18 more seats, leading to a 26% lower cost per seat. Combining these economics with our unique
network strategy, we will generate significant EBITDA, free cash flow and margin expansion in the second half of 2024 and in the years
to come.
I would like to thank you all for your support
and look forward to continuing this journey together.
John Rodgerson, CEO of Azul S.A.
| | First Quarter Results 2024 |
| | |
Consolidated Financial Results
The following income statement and operating data should
be read in conjunction with the quarterly results comments presented below:
| Income statement (R$ million) |
1Q24 |
1Q23¹ |
% Δ |
| Operating Revenue |
|
|
|
| Passenger revenue |
4,357.0 |
4,169.9 |
4.5% |
| Cargo revenue and other |
321.4 |
308.5 |
4.2% |
| Total operating revenue |
4,678.4 |
4,478.3 |
4.5% |
| Operating Expenses |
|
|
|
| Aircraft fuel |
(1,353.3) |
(1,673.4) |
-19.1% |
| Salaries and benefits |
(674.7) |
(537.5) |
25.5% |
| Depreciation and amortization |
(614.5) |
(567.7) |
8.3% |
| Airport fees |
(242.2) |
(262.4) |
-7.7% |
| Traffic and customer servicing |
(207.5) |
(195.6) |
6.1% |
| Sales and marketing |
(202.0) |
(174.0) |
16.1% |
| Maintenance and repairs |
(197.7) |
(157.9) |
25.2% |
| Other |
(385.8) |
(447.5) |
-13.8% |
| Total Operating Expenses |
(3,877.7) |
(4,015.9) |
-3.4% |
| Operating Result |
800.7 |
462.4 |
73.2% |
| Operating margin |
17.1% |
10.3% |
+6.8 p.p. |
| EBITDA |
1,415.2 |
1,030.1 |
37.4% |
| EBITDA margin |
30.3% |
23.0% |
+7.2 p.p. |
| Financial Result |
|
|
|
| Financial income |
44.9 |
53.5 |
-16.0% |
| Financial expenses² |
(1,161.9) |
(1,195.7) |
-2.8% |
| Derivative financial instruments, net² |
38.4 |
(193.9) |
n.a. |
| Foreign currency exchange, net |
(847.3) |
551.5 |
n.a. |
| Result Before Income Taxes |
(1,125.2) |
(322.2) |
249.2% |
| Income tax and social contribution |
- |
- |
n.a. |
| Deferred income tax and social contribution |
6.8 |
- |
n.a. |
| Net Result² |
(1,118.4) |
(322.2) |
247.1% |
| Net margin |
-23.9% |
-7.2% |
-16.7 p.p. |
| Adjusted Net Result² ³ |
(324.2) |
(727.6) |
-55.4% |
| Adjusted net margin² ³ |
-6.9% |
-16.2% |
+9.3 p.p. |
| Shares outstanding⁴ |
347.5 |
347.4 |
0.0% |
| EPS |
(3.22) |
(0.93) |
247.0% |
| EPS (US$) |
(0.65) |
(0.18) |
264.1% |
| EPADR (US$) |
(1.95) |
(0.54) |
264.1% |
| Adjusted EPS³ |
(0.93) |
(2.09) |
-55.5% |
| Adjusted EPS³ (US$) |
(0.19) |
(0.40) |
-53.3% |
| Adjusted EPADR³ (US$) |
(0.57) |
(1.21) |
-53.3% |
¹ 1Q23 operating results were adjusted for non-recurring
items.
² Excludes conversion rights related to convertible
debentures.
³ Adjusted for unrealized derivative results and
foreign currency. One ADR equals three preferred shares (PNs).
⁴ Shares outstanding do not include dilution related
to convertible and equity instruments.
| | First Quarter Results 2024 |
| | |
| Operating Data |
1Q24 |
1Q23¹ |
% Δ |
| ASK (million) |
11,077 |
10,799 |
2.6% |
| Domestic |
9,019 |
8,505 |
6.0% |
| International |
2,058 |
2,294 |
-10.3% |
| RPK (million) |
8,742 |
8,598 |
1.7% |
| Domestic |
7,028 |
6,703 |
4.8% |
| International |
1,714 |
1,895 |
-9.6% |
| Load factor (%) |
78.9% |
79.6% |
-0.7 p.p. |
| Domestic |
77.9% |
78.8% |
-0.9 p.p. |
| International |
83.3% |
82.6% |
+0.7 p.p. |
| Average fare (R$) |
604.4 |
590.8 |
2.3% |
| Passengers (thousands) |
7,209 |
7,058 |
2.1% |
| Block hours |
137,457 |
137,703 |
-0.2% |
| Aircraft utilization (hours per day)² |
11.5 |
9.9 |
16.8% |
| Departures |
78,535 |
78,739 |
-0.3% |
| Average stage length (km) |
1,161 |
1,160 |
0.0% |
| End of period operating passenger aircraft |
181 |
182 |
-0.5% |
| Fuel consumption (thousands of liters) |
318,301 |
318,462 |
-0.1% |
| Fuel consumption per ASK |
28.7 |
29.5 |
-2.6% |
| Full-time-equivalent employees |
15,568 |
13,651 |
14.0% |
| End of period FTE per aircraft |
86 |
75 |
14.7% |
| Yield (R$ cents) |
49.84 |
48.50 |
2.8% |
| RASK (R$ cents) |
42.23 |
41.47 |
1.8% |
| PRASK (R$ cents) |
39.33 |
38.61 |
1.9% |
| CASK (R$ cents) |
35.01 |
37.19 |
-5.9% |
| CASK ex-fuel (R$ cents) |
22.79 |
21.69 |
5.1% |
| Fuel cost per liter (R$) |
4.25 |
5.25 |
-19.1% |
| Break-even load factor (%) |
65.4% |
71.4% |
-6.0 p.p. |
| Average exchange rate (R$ per US$) |
4.95 |
5.20 |
-4.7% |
| End of period exchange rate |
4.98 |
5.08 |
-2.0% |
| Inflation (IPCA/LTM) |
3.93% |
5.96% |
-2.0 p.p. |
| WTI (average per barrel, US$) |
79.09 |
77.20 |
2.5% |
| Heating oil (US$ per gallon) |
2.71 |
2.92 |
-7.3% |
¹ 1Q23 operating results were adjusted for non-recurring
items.
² Excludes Cessna aircraft and freighters.
Operating Revenue
In 1Q24,
Azul´s total operating revenue increased R$200.1 million or 4.5%, reaching a first quarter record of R$4.7 billion.
Passenger revenue increased 4.5% on 2.6% more capacity compared to the same period last year, boosted
by healthy domestic and international demand environments and robust ancillary revenues.
Cargo revenue
and other reached R$321.4 million in 1Q24, 4.2% higher than 1Q23, mainly due to the solid performance
of our cargo and vacation businesses.
Total RASK and PRASK reached all-time records
for a first quarter of R$42.23 cents and R$39.33 cents, respectively, enabled by our rational capacity deployment and the competitive
advantages of our business model. Compared to 1Q23, RASK and PRASK increased 1.8% and 1.9%, respectively.
| | First Quarter Results 2024 |
| | |
| R$ cents |
1Q24 |
1Q23¹ |
% Δ |
| Operating revenue per ASK |
|
|
|
| Passenger revenue |
39.33 |
38.61 |
1.9% |
| Cargo revenue and other |
2.90 |
2.86 |
1.6% |
| Operating revenue (RASK) |
42.23 |
41.47 |
1.8% |
| Operating expenses per ASK |
|
|
|
| Aircraft fuel |
(12.22) |
(15.50) |
-21.2% |
| Salaries and benefits |
(6.09) |
(4.98) |
22.4% |
| Depreciation and amortization |
(5.55) |
(5.26) |
5.5% |
| Airport fees |
(2.19) |
(2.43) |
-10.0% |
| Traffic and customer servicing |
(1.87) |
(1.81) |
3.4% |
| Sales and marketing |
(1.82) |
(1.61) |
13.1% |
| Maintenance and repairs |
(1.78) |
(1.46) |
22.0% |
| Other operating expenses |
(3.48) |
(4.14) |
-16.0% |
| Total operating expenses (CASK) |
(35.01) |
(37.19) |
-5.9% |
| Operating income per ASK (RASK-CASK) |
7.23 |
4.28 |
68.8% |
¹ 1Q23 operating results were adjusted for non-recurring
items.
Operating Expenses
In 1Q24, operating expenses were R$3.9 billion,
3.4% lower than 1Q23 mainly explained by a 19.1% reduction in fuel price partially offset by the 2.6% increase in passenger capacity,
the 3.9% inflation in the period, and investments to support our growth strategy and maximize fleet availability.
The breakdown of our main operating expenses
compared to 1Q23 is as follows:
| § | | Aircraft fuel
decreased 19.1% to R$1,353.3 million even with a 2.6% increase in total capacity, mostly due to a 19.1% reduction in fuel price per
liter (excluding hedges) and a 2.6% reduction in fuel burn per ASK as a result of our more efficient next-generation fleet. |
| § | | Salaries and
benefits increased R$137.2 million compared to 1Q23, mainly driven by our capacity increase of 2.6%, a 5.5% union increase in salaries
as a result of collective bargaining agreements with labor unions applicable to all airline employees in Brazil, insourcing of certain
activities to reduce total costs, and hirings made in 4Q23 to reduce ground time and support our upcoming growth. |
| § | | Depreciation
and amortization increased 8.3% or R$46.8 million, driven by the increase in the right-of-use asset as a result of lease contract
renegotiations with lessors. |
| § | | Airport fees
reduced 7.7% or R$20.1 million, mostly driven by a 10.3% reduction in international capacity, which drives higher fees, partially
offset by 6.0% increase in our domestic capacity. |
| § | | Traffic and customer
servicing increased 6.1% or R$11.9 million, primarily due to the 2.1% growth in passengers and the 3.9% inflation in the period. |
| § | | Sales and marketing
increased R$28.0 million, mostly driven by the 4.5% growth in our passenger
revenue, leading to an increase in credit card fees and commissions. |
| § | | Maintenance and
repairs increased R$39.8 million compared to 1Q23, mainly due to a higher number of maintenance events to maximize aircraft availability,
partially offset by the 4.7% appreciation of the Brazilian real against the US dollar and savings from insourcing of maintenance events. |
| § | | Other reduced
13.8%, or R$61.7 million, mainly due to lower judicial claims in the period, insurance cost reductions and the 4.7% appreciation of the
Brazilian real against the US dollar.
|
| | First Quarter Results 2024 |
| | |
Non-Operating Results
| Net financial results (R$ million)¹ |
1Q24 |
1Q23 |
% Δ |
| Net financial expenses |
(1,117.0) |
(1,142.2) |
-2.2% |
| Derivative financial instruments, net |
38.4 |
(193.9) |
n.a. |
| Foreign currency exchange, net |
(847.3) |
551.5 |
n.a. |
| Net financial results |
(1,925.9) |
(784.6) |
145.5% |
¹ Excludes the conversion right related to the
convertible debentures.
Net financial expenses were
R$1,117.0 million in the quarter, with R$540.3 million in leases recognized as interest expense and R$292.4 million in interest on loans
and financing in 1Q24.
Derivative
financial instruments resulted in net gain of R$38.4 million in 1Q24 mostly due to fuel hedge
gains recorded during the period. As of March 31, 2024, Azul had hedged approximately 14.9% of its expected fuel consumption for the next
twelve months by using forward contracts and options.
Foreign
currency exchange, net registered a net loss of R$847.3 million in 1Q24 due to the 1.6% end
of period depreciation of the Brazilian real against the US dollar, resulting in an increase in lease liabilities and loans denominated
in foreign currency.
Liquidity and Financing
Azul ended
the first quarter with total liquidity of R$6.0 billion including long-term investments and receivables, security deposits, and maintenance
reserves. Immediate liquidity as of March 31, 2024 was R$2.7 billion, 50.8% higher compared to
1Q23 and representing 14.4% of our LTM revenues, even with unfavorable cash seasonality, and after we paid down over R$1.8 billion in
debt amortization, interest, and deferrals.
| Liquidity (R$ million) |
1Q24 |
4Q23 |
% Δ |
1Q23 |
% Δ |
| Cash, cash equivalents and short-term investments |
1,337.6 |
1,897.3 |
-29.5% |
466.4 |
186.8% |
| Accounts receivable |
1,376.3 |
1,124.0 |
22.4% |
1,332.9 |
3.3% |
| Immediate liquidity |
2,713.9 |
3,021.3 |
-10.2% |
1,799.2 |
50.8% |
| Cash as % of LTM revenue |
14.4% |
16.2% |
-1.8 p.p. |
10.4% |
+3.9 p.p. |
| Long-term investments and receivables |
805.1 |
796.5 |
1.1% |
843.7 |
-4.6% |
| Security deposits and maintenance reserves |
2,470.0 |
2,293.5 |
7.7% |
2,563.7 |
-3.7% |
| Total Liquidity |
5,989.0 |
6,111.4 |
-2.0% |
5,206.6 |
15.0% |
Azul’s debt
amortization schedule as of March 31, 2024 is presented below. The chart converts our dollar-denominated debt to reais using the quarter-end
foreign exchange rate of R$4.98.
| | First Quarter Results 2024 |
| | |
Loans and financial debt amortization as
of March 31, 2024¹
(R$ million converted at R$4.98 per dollar)
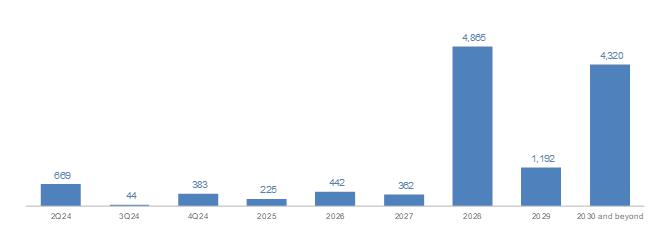
¹
Excludes convertible debentures, equity instruments and OEMs’ notes.
Compared to 4Q23, gross debt increased R$1,198.5
million to R$24,384.1 million, mostly due to the 1.6% end
of period depreciation of the Brazilian real against the US dollar in the quarter, resulting in an increase in lease liabilities and loans
denominated in foreign currency, in addition to the issuance of local debentures and the re-tap of Senior Secured Notes due 2028 in 1Q24,
partially offset by our continued deleveraging process with R$1.7 billion in payments of loans,
interest and leases during the quarter.
As of March 31, 2024, Azul’s average
debt maturity excluding lease liabilities and convertible debentures was 4.4 years, with an average interest rate of 11.1%. Average interest
rate on local and dollar-denominated obligations were equivalent to CDI + 4% and 10.6%, respectively.
| Loans and financing (R$ million)¹ |
1Q24 |
4Q23 |
% Δ |
1Q23 |
% Δ |
| Lease liabilities |
11,537.0 |
11,805.1 |
-2.3% |
13,765.5 |
-16.2% |
| Lease notes |
1,072.6 |
1,030.8 |
4.1% |
- |
n.a. |
| Finance lease liabilities |
644.7 |
650.7 |
-0.9% |
734.6 |
-12.2% |
| Other aircraft loans and financing |
347.7 |
399.4 |
-13.0% |
793.8 |
-56.2% |
| Loans and financing |
10,782.1 |
9,299.5 |
15.9% |
6,327.1 |
70.4% |
| % of non-aircraft debt in local currency |
13% |
10% |
+2.8 p.p. |
19% |
-5.7 p.p. |
| % of total debt in local currency |
6% |
4% |
+1.7 p.p. |
6% |
+0.4 p.p. |
| Gross debt |
24,384.1 |
23,185.6 |
5.2% |
21,621.0 |
12.8% |
¹ Considers the effect of hedges on debt.
Excludes convertible debentures, equity instruments and OEM notes. Consistently, shares outstanding should be adjusted to 504.5 million.
Azul’s
leverage ratio measured as net debt to LTM EBITDA decreased 1.4 point year-over-year, from 5.2x to 3.7x. We are confident in our
ability to continue reducing leverage organically and reaffirm our guidance to end 2024 with leverage of approximately 3.0x, below pre-pandemic
levels.
| Key financial ratios (R$ million) |
1Q24 |
4Q23 |
% Δ |
1Q23 |
% Δ |
| Cash¹ |
3,519.0 |
3,817.9 |
-7.8% |
2,642.9 |
33.1% |
| Gross debt² |
24,384.1 |
23,185.6 |
5.2% |
21,621.0 |
12.8% |
| Net debt |
20,865.1 |
19,367.7 |
7.7% |
18,978.1 |
9.9% |
| Net debt / EBITDA (LTM) |
3.7x |
3.7x |
0.0x |
5.2x |
-1.4x |
¹ Includes cash, cash equivalents, receivables, short and long-term
investments.
² Excludes convertible debentures, equity instruments and OEM notes.
| | First Quarter Results 2024 |
| | |
Fleet and Capex Expenditures
As of March 31, 2024, Azul had a passenger
operating fleet of 181 aircraft and a passenger contractual fleet of 183 aircraft, with an average aircraft age of 7.4 years excluding
Cessna aircraft. At the end of 1Q24, the 2 aircraft not included in our operating passenger fleet consisted of Embraer E1s subleased to
Breeze.
Azul ended 1Q24 with approximately 83% of
its capacity coming from next-generation aircraft, considerably higher than any competitor in the region.
| Passenger Contractual Fleet¹ |
1Q24 |
4Q23 |
% Δ |
1Q23 |
% Δ |
| Airbus widebody |
9 |
11 |
-18.2% |
14 |
-35.7% |
| Airbus narrowbody |
55 |
55 |
- |
53 |
3.8% |
| Embraer E2 |
20 |
20 |
- |
15 |
33.3% |
| Embraer E1 |
39 |
42 |
-7.1% |
47 |
-17.0% |
| ATR |
36 |
37 |
-2.7% |
41 |
-12.2% |
| Cessna |
24 |
24 |
- |
24 |
- |
| Total¹ |
183 |
189 |
-3.2% |
194 |
-5.7% |
| Aircraft under operating leases |
157 |
164 |
-4.3% |
168 |
-6.5% |
1 Includes 2 subleased aircraft.
| Passenger Operating Fleet |
1Q24 |
4Q23 |
% Δ |
1Q23 |
% Δ |
| Airbus widebody |
9 |
11 |
-18.2% |
11 |
-18.2% |
| Airbus narrowbody |
55 |
55 |
- |
53 |
3.8% |
| Embraer E2 |
20 |
20 |
- |
15 |
33.3% |
| Embraer E1 |
37 |
37 |
- |
42 |
-11.9% |
| ATR |
36 |
36 |
- |
37 |
-2.7% |
| Cessna |
24 |
24 |
- |
24 |
- |
| Total |
181 |
183 |
-1.1% |
182 |
-0.5% |
Capex
Capital expenditures totaled R$446.2 million in 1Q24,
mostly due to the capitalization of engine overhaul events, the acquisition of spare parts and pre-delivery payments in the quarter.
| Capex (R$ million) |
1Q24 |
4Q23 |
% Δ |
| Aircraft and maintenance and checks |
280.1 |
337.3 |
-17.0% |
| Intangible assets |
28.8 |
39.6 |
-27.1% |
| Pre-delivery payments |
121.7 |
84.1 |
44.8% |
| Other |
15.6 |
38.1 |
-59.1% |
| Capex |
446.2 |
499.1 |
-10.6% |
| Sale and leaseback |
-10.3 |
-91.7 |
-88.7% |
| Net capex from sales and leaseback |
435.9 |
407.4 |
7.0% |
| | First Quarter Results 2024 |
| | |
Environmental, Social and Governance (“ESG”)
Responsibility
The table below presents Azul’s key
ESG information according to the Sustainability Accounting Standards Board (SASB) standard for the airline industry:
| ESG Key Indicators |
1Q24 |
4Q23 |
% Δ |
| Environmental |
|
|
|
| Fuel |
|
|
|
| Total fuel consumed per ASK (GJ / ASK) |
1,079 |
1,098 |
-1.7% |
| Total fuel consumed (GJ x 1000) |
11,957 |
12,193 |
-1.9% |
| Fleet |
|
|
|
| Average age of operating fleet¹ (years) |
7.4 |
7.4 |
- |
| Social |
|
|
|
| Labor Relations |
|
|
|
| Employee gender: male (%) |
59.2% |
59.4% |
-0.2 p.p. |
| Employee gender: female (%) |
40.8% |
40.6% |
0.2 p.p. |
| Employee monthly turnover (%) |
0.9% |
0.7% |
0.2 p.p. |
| Employee covered under collective bargaining agreements (%) |
100% |
100% |
- |
| Volunteers (#) |
6,385 |
6,012 |
6.2% |
| Governance |
|
|
|
| Management |
|
|
|
| Independent directors (%) |
92% |
92% |
- |
| Percent of Board members that are women (%) |
25% |
25% |
- |
| Board of Directors' average age (years) |
58 |
58 |
0.4% |
| Director meeting attendance (%) |
100% |
100% |
- |
| Board size (#) |
12 |
12 |
- |
| Participation of women in leadership positions (%) |
38% |
38% |
- |
¹ Excludes Cessna aircraft.
| | First Quarter Results 2024 |
| | |
Conference Call Details
Monday, May 13, 2024
11:00 a.m. (EDT) | 12:00 p.m. (Brasília time)
USA: +1 253 205-0468
Brazil: +55 11 4632-2237 or +55 21 3958-7888
Code: 899 3234 4545
Webcast: ri.voeazul.com.br/en/
About Azul
Azul S.A. (B3: AZUL4, NYSE: AZUL), the largest airline
in Brazil by number of flight departures and cities served, offers 1,000 daily flights to over 160 destinations. With an operating fleet
of over 180 aircraft and more than 16,000 Crewmembers, the Company has a network of 300 non-stop routes. Azul was named by Cirium (leading
aviation data analysis company) as the most on-time airline in the world in 2022, being the first Brazilian airline to obtain this honor.
In 2020 Azul was awarded best airline in the world by TripAdvisor, the first time a Brazilian flag carrier earned the number one ranking
in the Traveler’s Choice Awards. For more information visit ri.voeazul.com.br/en/.
Contact:
Investor Relations
Tel: +55 11 4831 2880
invest@voeazul.com.br
|
Media Relations
Tel: +55 11 4831 1245
imprensa@voeazul.com.br
|
| | First Quarter Results 2024 |
| | |
Balance Sheet – IFRS
| (R$ million) |
March 31, 2024 |
December 31, 2023 |
March 31, 2023 |
| Assets |
20,895.9 |
20,532.9 |
17,402.2 |
| Current assets |
4,863.2 |
5,044.1 |
3,949.7 |
| Cash and cash equivalents |
1,337.6 |
1,897.3 |
466.4 |
| Accounts receivable |
1,361.2 |
1,109.4 |
1,267.1 |
| Sublease receivables |
15.1 |
14.6 |
65.8 |
| Inventories |
943.3 |
799.2 |
718.9 |
| Security deposits and maintenance reserves |
503.2 |
515.7 |
941.0 |
| Taxes recoverable |
205.3 |
219.4 |
234.7 |
| Derivative financial instruments |
20.8 |
21.9 |
21.2 |
| Prepaid expenses |
203.5 |
221.1 |
228.1 |
| Other current assets |
273.2 |
245.5 |
6.6 |
| Non-current assets |
16,032.7 |
15,488.8 |
13,452.5 |
| Long-term investments |
791.5 |
780.3 |
753.8 |
| Sublease receivables |
13.6 |
16.2 |
89.9 |
| Security deposits and maintenance reserves |
1,966.8 |
1,777.8 |
1,622.8 |
| Derivative financial instruments |
0.1 |
- |
- |
| Prepaid expenses |
- |
- |
194.0 |
| Other non-current assets |
311.2 |
143.8 |
8.8 |
| Right of use – leased aircraft and other assets |
7,933.9 |
8,075.9 |
6,629.6 |
| Right of use – maintenance of leased aircraft |
1,007.1 |
935.7 |
764.5 |
| Property and equipment |
2,529.3 |
2,295.8 |
1,925.5 |
| Intangible assets |
1,479.1 |
1,463.2 |
1,463.7 |
| Liabilities and equity |
20,895.9 |
20,532.9 |
17,402.2 |
| Current liabilities |
14,411.9 |
14,748.9 |
15,884.4 |
| Loans and financing |
1,245.7 |
1,100.1 |
1,400.8 |
| Convertible instruments |
63.2 |
25.8 |
41.0 |
| Leases |
3,108.4 |
3,349.1 |
4,578.7 |
| Lease notes |
125.2 |
121.9 |
- |
| Lease equity |
428.5 |
216.4 |
- |
| Accounts payable |
2,338.6 |
2,202.0 |
2,715.6 |
| Factoring |
117.3 |
290.8 |
- |
| Air traffic liability |
5,168.7 |
5,205.9 |
4,091.9 |
| Salaries and benefits |
490.3 |
474.8 |
491.7 |
| Insurance payable |
1.1 |
75.9 |
62.8 |
| Taxes payable |
132.7 |
142.2 |
135.4 |
| Derivative financial instruments |
15.6 |
68.9 |
139.9 |
| Provisions |
399.1 |
736.4 |
1,079.1 |
| Airport fees |
628.5 |
588.4 |
1,033.7 |
| Other |
148.8 |
150.4 |
113.7 |
| Non-current liabilities |
28,852.5 |
27,111.9 |
21,244.5 |
| Loans and financing |
9,884.1 |
8,598.9 |
5,720.1 |
| Convertible instruments |
1,070.3 |
1,175.8 |
1,482.7 |
| Leases |
9,073.3 |
9,106.8 |
9,921.4 |
| Lease notes |
947.4 |
908.9 |
- |
| Lease equity |
1,634.2 |
1,443.4 |
- |
| Accounts payable |
1,296.4 |
1,320.9 |
403.2 |
| Derivative financial instruments |
0.1 |
0.8 |
- |
| Provision |
2,846.8 |
2,404.4 |
2,140.4 |
| Airport fees |
1,140.3 |
1,171.7 |
504.9 |
| Other non-current liabilities |
959.6 |
980.3 |
1,071.8 |
| Equity |
(22,368.4) |
(21,327.8) |
(19,726.8) |
| Issued capital |
2,315.6 |
2,314.8 |
2,314.0 |
| Advance for future capital increase |
0.0 |
0.8 |
- |
| Capital reserve |
2,041.8 |
2,029.6 |
1,990.4 |
| Treasury shares |
(11.6) |
(9.0) |
(13.1) |
| Accumulated other comprehensive result |
3.1 |
3.1 |
5.3 |
| Accumulated losses |
(26,717.4) |
(25,667.1) |
(24,023.3) |
| | First Quarter Results 2024 |
| | |
Cash Flow
Statement – IFRS
| (R$ million) |
1Q24 |
1Q23 |
% Δ |
| Cash flows from operating activities |
|
|
|
| Net profit (loss) for the period |
(1,050.3) |
(736.6) |
42.6% |
| Total non-cash adjustments |
|
|
|
| Depreciation and amortization |
614.5 |
567.7 |
8.3% |
| Unrealized derivatives |
(189.9) |
275.0 |
n.a. |
| Exchange gain and (losses) in foreign currency |
844.6 |
(583.3) |
n.a. |
| Financial
income and expenses, net |
1,164.4 |
975.9 |
19.3% |
| Provisions |
68.9 |
97.7 |
-29.5% |
| Result
from modification of lease and provision |
(27.7) |
(22.4) |
23.7% |
| Other |
(223.9) |
214.7 |
n.a. |
| Changes in operating assets and liabilities |
|
|
|
| Trade and other receivables |
(206.5) |
439.3 |
n.a. |
| Sublease receivables |
- |
11.2 |
n.a. |
| Security deposits and maintenance reserves |
(57.6) |
9.4 |
n.a. |
| Advances to suppliers |
(523.5) |
(496.2) |
5.5% |
| Other assets |
(110.0) |
(46.5) |
136.7% |
| Derivatives |
(14.7) |
(47.8) |
-69.3% |
| Accounts payable |
427.6 |
349.4 |
22.4% |
| Salaries and benefits |
16.3 |
53.8 |
-69.6% |
| Air traffic liability |
(95.6) |
(93.7) |
2.0% |
| Provisions |
(61.9) |
(49.9) |
24.0% |
| Other liabilities |
(149.7) |
246.5 |
n.a. |
| Interest paid |
(488.1) |
(120.9) |
303.6% |
| Net cash generated (used) by operating activities |
(63.2) |
1,043.1 |
n.a. |
| |
|
|
|
| Cash flows from investing activities |
|
|
|
| Sales and leaseback |
10.3 |
- |
n.a. |
| Acquisition of intangible |
(28.8) |
(40.2) |
-28.2% |
| Acquisition of property and equipment |
(417.4) |
(41.6) |
903.4% |
| Net cash generated (used) in investing activities |
(435.9) |
(81.8) |
433.0% |
| |
|
|
|
| Cash flows from financing activities |
|
|
|
| Loans and financing |
|
|
|
| Proceeds |
1,440.6 |
302.3 |
376.6% |
| Repayment |
(396.5) |
(327.1) |
21.2% |
| Lease repayment |
(813.5) |
(407.7) |
99.5% |
| Factoring |
(287.5) |
(727.4) |
-60.5% |
| Capital increase |
0.0 |
- |
n.a. |
| Treasury shares |
(2.5) |
(2.9) |
-11.7% |
| Net cash generated (used) in financing activities |
(59.4) |
(1,162.8) |
-94.9% |
| |
|
|
|
| Exchange gain (loss) on cash and cash equivalents |
(1.2) |
(0.6) |
116.2% |
| |
|
|
|
| Net decrease in cash and cash equivalents |
(559.7) |
(202.0) |
177.1% |
| |
|
|
|
| Cash and cash equivalents at the beginning of the period |
1,897.3 |
668.3 |
183.9% |
| |
|
|
|
| Cash and cash equivalents at the end of the period |
1,337.6 |
466.4 |
186.8% |
| | First Quarter Results 2024 |
| | |
Glossary
Aircraft Utilization
Average number of block hours per day per aircraft operated.
Available Seat Kilometers (ASK)
Number of aircraft seats multiplied by the
number of kilometers flown.
Completion Factor
Percentage of scheduled
flights that were executed.
Cost per ASK (CASK)
Operating expenses divided by available seat kilometers.
Cost per ASK ex-fuel (CASK ex-fuel)
Operating expenses
divided by available seat kilometers excluding fuel expenses.
EBITDA
Earnings before interest, taxes, depreciation,
and amortization. Adjusted EBITDA excludes non-recurring items.
FTE (Full-Time Equivalent)
Equivalent number of employees assuming
all work full-time.
Immediate Liquidity
Cash, cash equivalents, short-term investments,
and receivables.
Load Factor
Number of passengers as a percentage of
number of seats flown (calculated by dividing RPK by ASK).
LTM
Last twelve months ended on the last day
of the quarter presented.
Revenue Passenger Kilometers (RPK)
One-fare paying passenger transported one
kilometer. RPK is calculated by multiplying the number of revenue passengers by the number of kilometers flown.
Passenger Revenue per Available Seat
Kilometer (PRASK)
Passenger revenue divided by available seat
kilometers (also equal to load factor multiplied by yield).
Revenue per ASK (RASK)
Operating revenue divided by available seat kilometers.
Stage Length
The average number of kilometers flown per flight.
Trip Cost
Average cost of each flight calculated by dividing total operating expenses by total number of departures.
Yield
Average amount paid per passenger to fly
one kilometer. Usually, yield is calculated as average revenue per revenue passenger kilometer.
| | First Quarter Results 2024 |
| | |
This press release includes estimates and
forward-looking statements within the meaning of the U.S. federal securities laws. These estimates and forward-looking statements are
based mainly on our current expectations and estimates of future events and trends that affect or may affect our business, financial condition,
results of operations, cash flow, liquidity, prospects, and the trading price of our preferred shares, including in the form of ADSs.
Although we believe that these estimates and forward-looking statements are based upon reasonable assumptions, they are subject to many
significant risks, uncertainties and assumptions and are made in light of information currently available to us. In addition, in this
release, the words “may,” “will,” “estimate,” “anticipate,” “intend,” “expect,”
“should” and similar words are intended to identify forward-looking statements. You should not place undue reliance on such
statements, which speak only as of the date they were made. Azul is not under the obligation to update publicly or to revise any forward-looking
statements after we distribute this press release because of new information, future events, or other factors. Our independent public
auditors have neither examined nor compiled the forward-looking statements and, accordingly, do not provide any assurance with respect
to such statements. In light of the risks and uncertainties described above, the future events and circumstances discussed in this release
might not occur and are not guarantees of future performance. Because of these uncertainties, you should not make any investment decision
based upon these estimates and forward-looking statements.
In this press release, we present EBITDA
and EBITDA margin, which are non-IFRS performance measures and are not financial performance measures determined in accordance with IFRS
and should not be considered in isolation or as alternatives to operating income or net income or loss, or as indications of operating
performance, or as alternatives to operating cash flows, or as indicators of liquidity, or as the basis for the distribution of dividends.
Accordingly, you are cautioned not to place undue reliance on this information.
SIGNATURES
Pursuant to the requirements of the Securities Exchange Act of 1934, the registrant has duly caused this report to be signed on its behalf by the undersigned, thereunto duly authorized.
Date: May 10, 2024
Azul S.A.
By: /s/ Alexandre Wagner Malfitani
Name: Alexandre Wagner Malfitani
Title: Chief Financial Officer
Azul (NYSE:AZUL)
Historical Stock Chart
From Apr 2024 to May 2024

Azul (NYSE:AZUL)
Historical Stock Chart
From May 2023 to May 2024
