Form NPORT-P - Monthly Portfolio Investments Report on Form N-PORT (Public)
22 January 2025 - 4:37AM
Edgar (US Regulatory)
THE
TAIWAN FUND, INC.
Schedule
of Investments / November 30, 2024 (Showing
Percentage of Net Assets) (unaudited)
| | |
SHARES | | |
US $
VALUE | |
| COMMON STOCKS – 91.1% | |
| | | |
| | |
| COMMUNICATION SERVICES — 1.4% | |
| | | |
| | |
| Diversified Telecommunication Services — 1.4% | |
| | | |
| | |
| Chunghwa Telecom Co. Ltd. | |
| 1,285,000 | | |
$ | 4,865,776 | |
| TOTAL COMMUNICATION SERVICES | |
| | | |
| 4,865,776 | |
| CONSUMER DISCRETIONARY — 8.2% | |
| | | |
| | |
| Hotels, Restaurants & Leisure — 0.5% | |
| | | |
| | |
| Gourmet Master Co. Ltd. | |
| 526,000 | | |
| 1,549,678 | |
| Household Durables — 2.8% | |
| | | |
| | |
| Nien Made Enterprise Co. Ltd. | |
| 799,000 | | |
| 9,838,993 | |
| Leisure Products — 2.5% | |
| | | |
| | |
| Giant Manufacturing Co. Ltd. | |
| 520,000 | | |
| 2,433,273 | |
| Merida Industry Co. Ltd. | |
| 1,290,000 | | |
| 6,354,093 | |
| | |
| | | |
| 8,787,366 | |
| Textiles, Apparel & Luxury Goods — 2.4% | |
| | | |
| | |
| Eclat Textile Co. Ltd. | |
| 80,000 | | |
| 1,305,298 | |
| Feng TAY Enterprise Co. Ltd. | |
| 564,800 | | |
| 2,277,770 | |
| Fulgent Sun International Holding Co. Ltd. | |
| 505,000 | | |
| 1,741,218 | |
| Makalot Industrial Co. Ltd. | |
| 320,000 | | |
| 3,157,344 | |
| | |
| | | |
| 8,481,630 | |
| TOTAL CONSUMER DISCRETIONARY | |
| | | |
| 28,657,667 | |
| CONSUMER STAPLES — 2.1% | |
| | | |
| | |
| Consumer Staples Distribution & Retail — 2.1% | |
| | | |
| | |
| President Chain Store Corp. | |
| 869,000 | | |
| 7,236,539 | |
| TOTAL CONSUMER STAPLES | |
| | | |
| 7,236,539 | |
| INDUSTRIALS — 6.3% | |
| | | |
| | |
| Electrical Equipment — 6.3% | |
| | | |
| | |
| Bizlink Holding, Inc. | |
| 815,000 | | |
| 16,233,260 | |
| Fortune Electric Co. Ltd. (a) | |
| 330,400 | | |
| 5,594,311 | |
| TOTAL INDUSTRIALS | |
| | | |
| 21,827,571 | |
| INFORMATION TECHNOLOGY — 70.8% | |
| | | |
| | |
| Communications Equipment — 0.8% | |
| | | |
| | |
| Arizon RFID Technology Cayman Co. Ltd. | |
| 20,000 | | |
| 134,840 | |
| EZconn Corp. (a) | |
| 166,000 | | |
| 2,580,735 | |
| | |
| | | |
| 2,715,575 | |
| Electronic Equipment, Instruments & Components — 11.1% | |
| | | |
| | |
| All Ring Tech Co. Ltd. | |
| 84,000 | | |
| 1,121,017 | |
| Delta Electronics, Inc. | |
| 1,189,000 | | |
| 13,946,033 | |
| E Ink Holdings, Inc. | |
| 187,000 | | |
| 1,617,677 | |
| Fositek Corp. (a) | |
| 276,000 | | |
| 7,664,071 | |
| Hon Hai Precision Industry Co. Ltd. | |
| 426,000 | | |
| 2,563,895 | |
| Lotes Co. Ltd. | |
| 146,000 | | |
| 8,045,439 | |
| Unimicron Technology Corp. | |
| 766,000 | | |
| 3,513,653 | |
| | |
| | | |
| 38,471,785 | |
| Semiconductors & Semiconductor Equipment — 45.8% | |
| | | |
| | |
| Alchip Technologies Ltd. (a) | |
| 85,000 | | |
| 5,796,109 | |
| ASPEED Technology, Inc. | |
| 21,000 | | |
| 2,640,920 | |
| eMemory Technology, Inc. | |
| 151,000 | | |
| 13,550,627 | |
| Global Unichip Corp. (a) | |
| 100,000 | | |
| 3,663,455 | |
| Grand Process Technology Corp. | |
| 252,000 | | |
| 12,761,752 | |
| Jentech Precision Industrial Co. Ltd. (a) | |
| 324,000 | | |
| 13,814,611 | |
| LandMark Optoelectronics Corp. (a) | |
| 362,000 | | |
| 3,822,492 | |
| MediaTek, Inc. | |
| 84,000 | | |
| 3,245,390 | |
| SDI Corp. | |
| 616,000 | | |
| 1,934,304 | |
| Taiwan Semiconductor Manufacturing Co. Ltd. | |
| 2,781,000 | | |
| 85,271,557 | |
| Visual Photonics Epitaxy Co. Ltd. (a) | |
| 1,954,000 | | |
| 10,226,272 | |
| WinWay Technology Co. Ltd. | |
| 77,000 | | |
| 2,797,155 | |
| | |
| | | |
| 159,524,644 | |
| Technology Hardware, Storage & Peripherals — 13.1% | |
| | | |
| | |
| Asia Vital Components Co. Ltd. (a) | |
| 607,000 | | |
| 12,015,547 | |
| AURAS Technology Co. Ltd. | |
| 25,000 | | |
| 524,890 | |
| King Slide Works Co. Ltd. (a) | |
| 300,000 | | |
| 13,483,976 | |
| Quanta Computer, Inc. | |
| 1,624,000 | | |
| 14,548,656 | |
| Wiwynn Corp. | |
| 84,000 | | |
| 5,003,848 | |
| | |
| | | |
| 45,576,917 | |
| TOTAL INFORMATION TECHNOLOGY | |
| | | |
| 246,288,921 | |
| MATERIALS — 2.3% | |
| | | |
| | |
| Metals & Mining — 2.3% | |
| | | |
| | |
| Century Iron & Steel Industrial Co. Ltd. (a) | |
| 1,488,000 | | |
| 8,016,501 | |
| TOTAL MATERIALS | |
| | | |
| 8,016,501 | |
TOTAL COMMON STOCKS
(Cost — $202,585,946) | |
| | | |
| 316,892,975 | |
TOTAL INVESTMENTS — 91.1%
(Cost — $202,585,946) | |
| | | |
| 316,892,975 | |
| OTHER ASSETS AND LIABILITIES, NET—8.9% | |
| | | |
| 30,997,900 | |
| NET ASSETS—100.0% | |
| | | |
| 347,890,875 | |
Legend:
US $ – United States dollar
| (a) | All or a portion of the security is on loan. The market value
of the securities on loan is $35,641,334, collateralized by non-cash collateral such as U.S. Government securities in the amount of $38,240,279. |
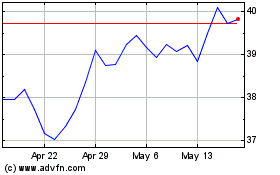
Taiwan (NYSE:TWN)
Historical Stock Chart
From Feb 2025 to Mar 2025

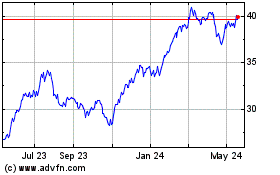
Taiwan (NYSE:TWN)
Historical Stock Chart
From Mar 2024 to Mar 2025
