ADVFN Logo

We could not find any results for:
Make sure your spelling is correct or try broadening your search.

Trending Now

Toplists

It looks like you aren't logged in.
Click the button below to log in and view your recent history.

Hot Features

Registration Strip Icon for charts Register for streaming realtime charts, analysis tools, and prices.

Bitcoin (BTC) Rallies to $10,000, Attempts to Breach the Resistance at $10,000

Share On Facebook
share on Linkedin
Print

Key Resistance Zones: $10,000, $11,000, $12,000
Key Support Zones: $7, 000, $6, 000, $5,000

©

BTC/USD Long-term Trend: Bullish
Bitcoin has finally broken the $9,200 and $9,400 resistances as the market approaches the $10,000 resistance. Yesterday, price was hovering between $9,000 and $9,300 before penetrating the resistance zone. From the daily chart, Bitcoin has reclaimed the $9,500 price level in February. The bulls are likely to push above the $10,000 resistance but are currently facing resistance.


BTC/USD – Daily Chart

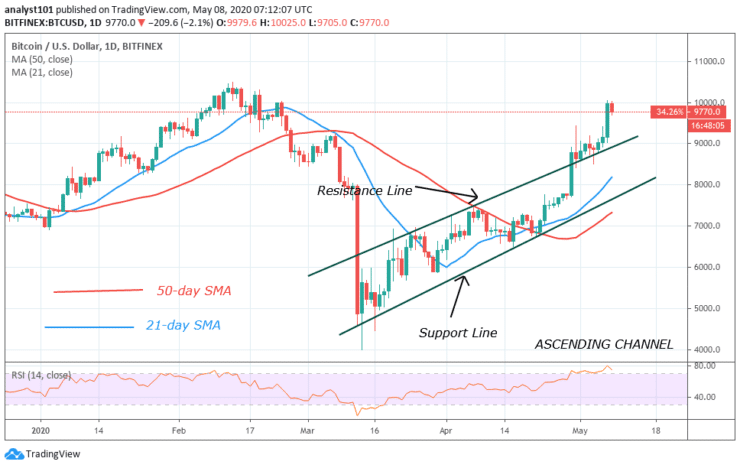
Daily Chart Indicators Reading:
Bitcoin is at level 78 of the daily Relative strength index. This indicates that the market is in the overbought region where sellers are likely to emerge. In some trending markets, the oversold or overbought conditions may not hold. The 21-day SMA and the 50-day SMA are sloping upward.

BTC/USD Medium-term Trend: Bullish
On the 4– hour chart, Bitcoin is in an uptrend. The price action indicates that on April 30, the bulls fail to break the $9,200 resistance. Yesterday, the $9,200 and $9,400 were broken as the market approaches $10,000 resistance. Presently, the bulls are being resisted at the $10,000 resistance. The crypto is retracing and may reach a low of $9,500.


BTC/USD – 4 Hour Chart

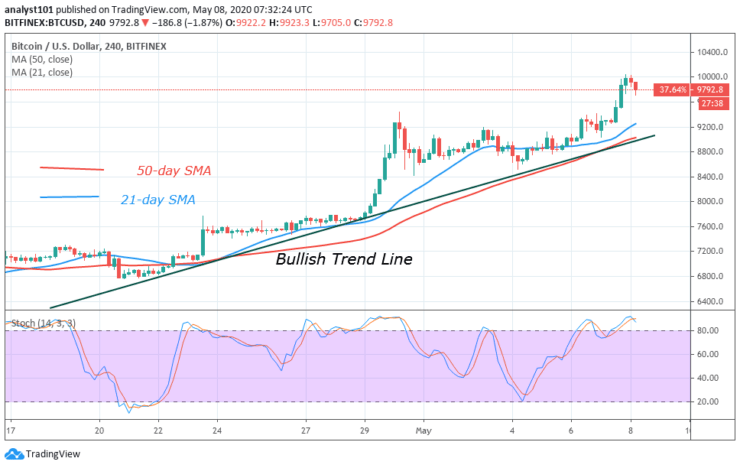
4-hour Chart Indicators Reading
BTC is currently above 80% range of the daily stochastic. The price is in the overbought region. The SMAs are sloping upward as Bitcoin continues its rise. Sellers are likely to emerge in the overbought region.

General Outlook for Bitcoin (BTC)
Bitcoin has reached the $10,000 price level. The coin is gaining more bullish momentum as it is expected to hit the $10,500. However, at the moment, the bulls are facing resistance as BTC retraces. The uptrend will resume immediately after the retracement.

Source: https://learn2.trade

CLICK HERE TO REGISTER FOR FREE ON ADVFN, the world's leading stocks and shares information website, provides the private investor with all the latest high-tech trading tools and includes live price data streaming, stock quotes and the option to access 'Level 2' data on all of the world's key exchanges (LSE, NYSE, NASDAQ, Euronext etc).

This area of the ADVFN.com site is for independent financial commentary. These blogs are provided by independent authors via a common carrier platform and do not represent the opinions of ADVFN Plc. ADVFN Plc does not monitor, approve, endorse or exert editorial control over these articles and does not therefore accept responsibility for or make any warranties in connection with or recommend that you or any third party rely on such information. The information available at ADVFN.com is for your general information and use and is not intended to address your particular requirements. In particular, the information does not constitute any form of advice or recommendation by ADVFN.COM and is not intended to be relied upon by users in making (or refraining from making) any investment decisions. Authors may or may not have positions in stocks that they are discussing but it should be considered very likely that their opinions are aligned with their trading and that they hold positions in companies, forex, commodities and other instruments they discuss.

Leave A Reply

 
Do you want to write for our Newspaper? Get in touch: newspaper@advfn.com