Key Resistance Levels: 74.00, 76.00, 78.00
Key Support Levels: 58.00, 60.00, 62.00

AUD/JPY Price Long-term Trend: Ranging
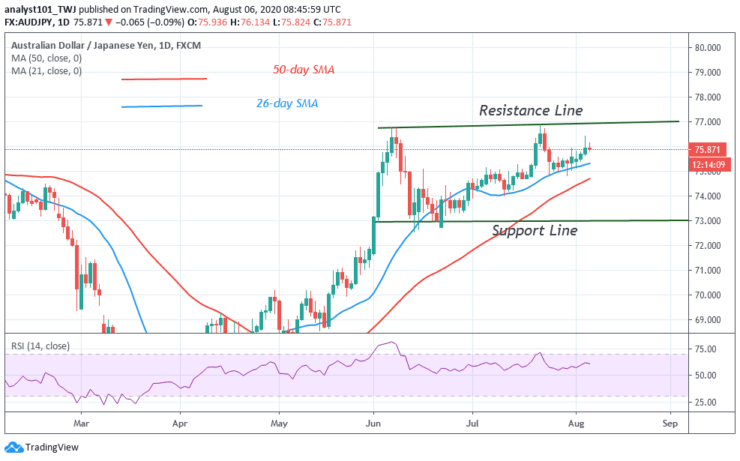
The AUD/JPY pair is on a sideways trend. The pair fluctuates between level 73.00 and 77.00. The price tested the resistance line in July but was repelled. It fell to level 75.00 and resumed a fresh uptrend. This has been the market scenario. The pair is yet to trend,.

Daily Chart Indicators Reading:
The 21-day SMA and the 50-day SMA are sloping horizontally indicating the sideways move. The pair has fallen to level 60 of the Relative Strength Index period 14. The price is in the uptrend zone but above the centerline 50.
AUD/JPY Medium-term Trend: Ranging
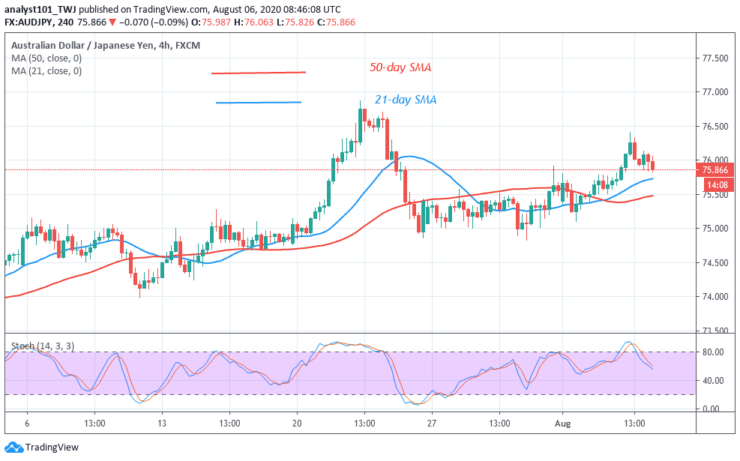
On the 4-hour chart, the pair is fluctuating and consolidating above level 74.00. In July, the price rose to level 76.50 but fell back to level 75. AUD/JPY has since resumed a sideways. In August, the pair tested the resistance and price fell to level 75.00.
4-hour Chart Indicators Reading
The AUD/JPY pair is currently below 80% range of the daily stochastic. It indicates a bearish momentum. The price action is indicating a bullish signal. The SMAs are sloping sideways move indicating the sideways trend.

General Outlook for AUD/JPY
The AUD/JPY pair is currently fluctuating between levels 73 and 77. Since June, the market has continued to fluctuate between the price range. The key levels of the price range are yet to be broken.
Source: https://learn2.trade


 Hot Features


