Hot Features

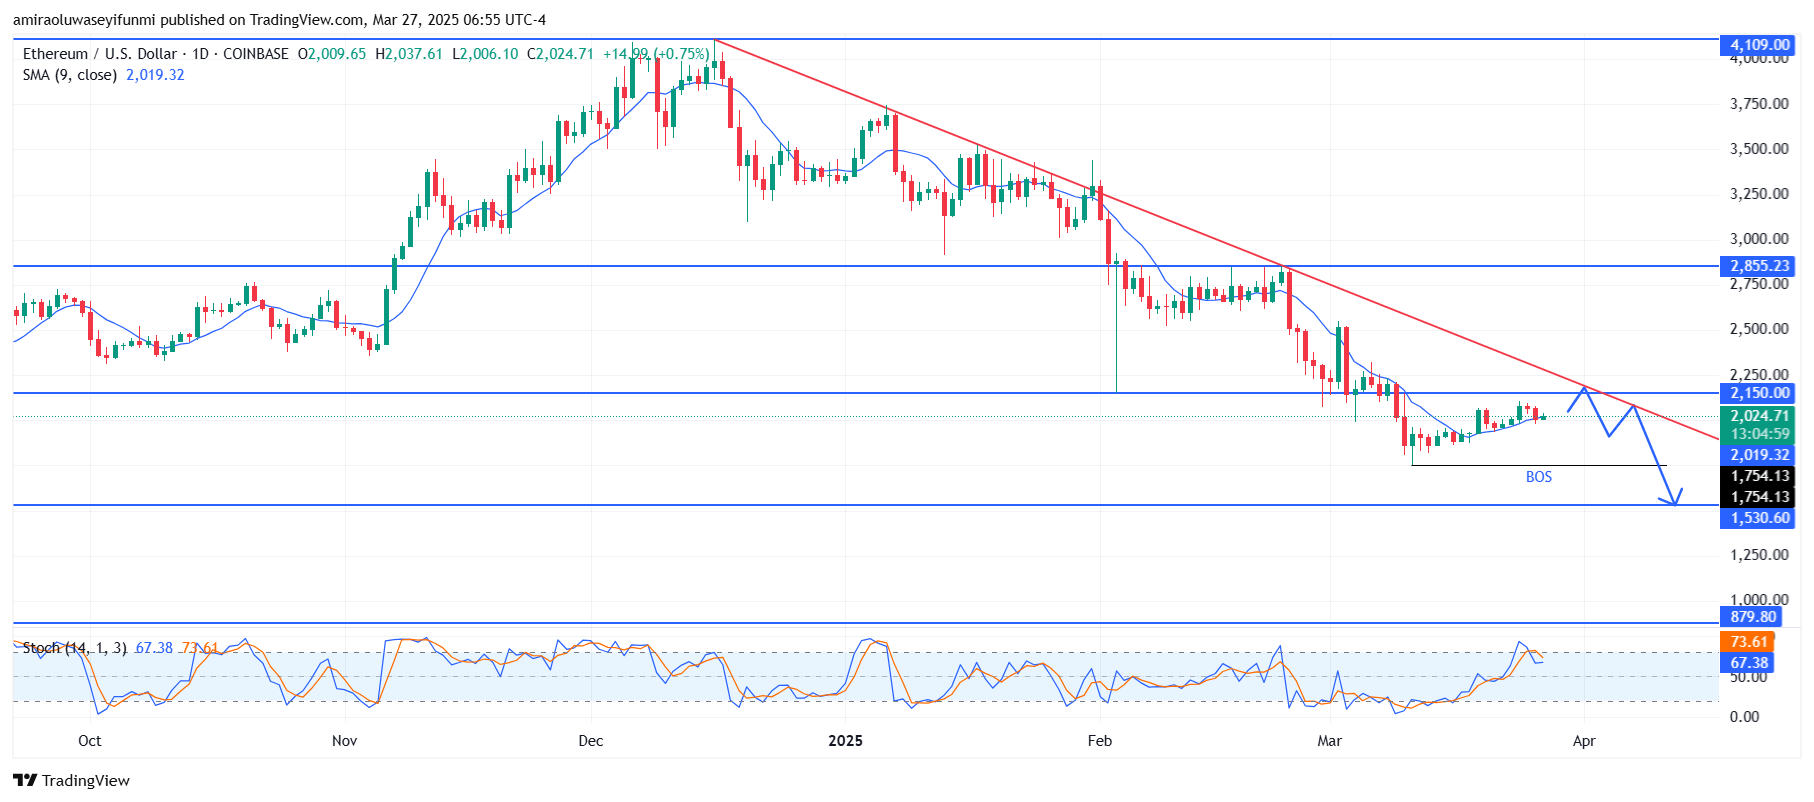
ETHUSD remains in a bearish trend despite short-term recovery. ETHUSD remains below the long-term descending trendline, reflecting the dominance of sellers. The price recently rebounded from the $1,750 support level but is currently facing strong resistance at $2,150. This level aligns with both the trendline resistance and a previous structural high, making it a critical decision point. If price action forms a rejection pattern, such as a bearish engulfing candle or a long upper wick, it would indicate that sellers are regaining control. Furthermore, the market structure break (BOS) confirms that the broader downtrend is still intact, reinforcing expectations of further downside movement.

If ETHUSD fails to reclaim $2,150, the bearish trajectory is likely to continue. The immediate downside target is the $1,750 support level, where buyers could attempt to hold the price. However, if bearish momentum intensifies, ETHUSD could break below this support and extend losses toward the $1,530 zone. A confirmed breakdown of $1,530 would validate a deeper sell-off, potentially driving price action below the $1,500 threshold. Given the prevailing downtrend and weakening bullish attempts, ETHUSD remains vulnerable to further declines in the near term.
ETH Key Levels
Supply Levels: $2150, $2860, $4110
Demand Levels: $1750, $1530, $880
 What are the indicators saying?
The 9-period SMA at $2,020 is acting as dynamic resistance, preventing a sustained bullish push. The Stochastic indicator is hovering around 73, which signals that ETHUSD is approaching overbought conditions. This suggests that a price reversal could be imminent if buyers fail to maintain upward momentum. Additionally, the price has struggled to break above the descending trendline, reinforcing the overall bearish sentiment. If the Stochastic indicator forms a downward crossover, it would provide further confirmation of an impending sell-off.
Learn from market wizards: Books to take your trading to the next level