ADVFN ADVFN

We could not find any results for:
Make sure your spelling is correct or try broadening your search.

Trending Now

Toplists

It looks like you aren't logged in.
Click the button below to log in and view your recent history.

Hot Features

Registration Strip Icon for pro Trade like a pro: Leverage real-time discussions and market-moving ideas to outperform.

ETHUSD Remains Pressured Under Key Trend Resistance

Share On Facebook
share on Linkedin
Print

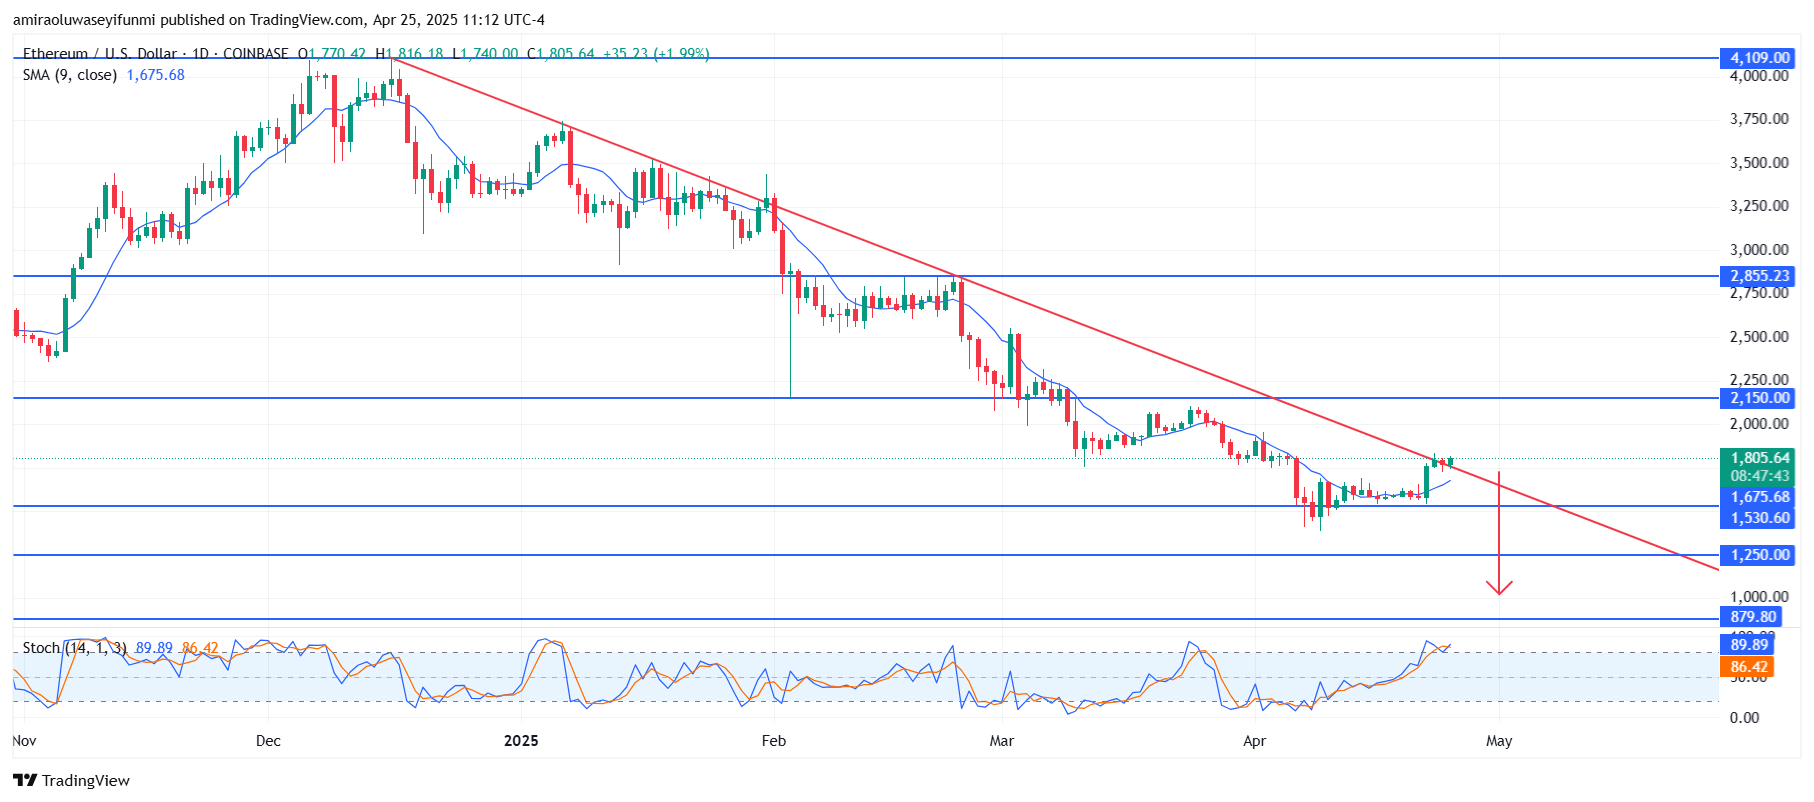
ETHUSD remains pressured under key trend resistance. The overall market trend is bearish. The action of the price clearly highlights a clear downward trend, defined by a descending trendline stretching from February highs. ETHUSD is currently testing this trendline, which is near $1800, but struggles to break it decisively. Major horizontal support and resistance levels include $2150 as major resistance above, while $1530 and $1250 stand out as key supports below. The failure to breach the trendline and stay above $1800 reinforces selling pressure.

©


Given these observations, ETHUSD is projected to continue lower unless a strong bullish breakout occurs above $1800 and $2150. A rejection at the current trendline could trigger a decline toward $1530 in the short term, and a break below this level would likely open the door for a deeper fall toward $1250. If bearish momentum accelerates, further downside toward $880 could eventually come into play.

ETH Key Levels

Supply Levels: $2150, $2860, $4110
Demand Levels: $1530, $1250, $880

ETHUSD Remains Pressured Under Key Trend Resistance


What are the indicators saying?

The ETHUSD daily chart shows bearish signals from technical indicators. Before the recent short-term pullback to the upside, the price had remained below the 9-day Simple Moving Average (SMA) around $1670, confirming the broader downside bias. Additionally, the Stochastic Oscillator is hovering above 85, indicating an overbought condition and suggesting a likely bearish reversal soon. The strong momentum upwards may be fading as the oscillator lines start to flatten, aligning with the broader bearish setup.


Learn from market wizards: Books to take your trading to the next level


CLICK HERE TO REGISTER FOR FREE ON ADVFN, the world's leading stocks and shares information website, provides the private investor with all the latest high-tech trading tools and includes live price data streaming, stock quotes and the option to access 'Level 2' data on all of the world's key exchanges (LSE, NYSE, NASDAQ, Euronext etc).

This area of the ADVFN.com site is for independent financial commentary. These blogs are provided by independent authors via a common carrier platform and do not represent the opinions of ADVFN Ltd. ADVFN Ltd does not monitor, approve, endorse or exert editorial control over these articles and does not therefore accept responsibility for or make any warranties in connection with or recommend that you or any third party rely on such information. The information available at ADVFN.com is for your general information and use and is not intended to address your particular requirements. In particular, the information does not constitute any form of advice or recommendation by ADVFN.COM and is not intended to be relied upon by users in making (or refraining from making) any investment decisions. Authors may or may not have positions in stocks that they are discussing but it should be considered very likely that their opinions are aligned with their trading and that they hold positions in companies, forex, commodities and other instruments they discuss.

Comments are closed

 
Do you want to write for our Newspaper? Get in touch: newspaper@advfn.com