ADVFN ADVFN

We could not find any results for:
Make sure your spelling is correct or try broadening your search.

Trending Now

Toplists

It looks like you aren't logged in.
Click the button below to log in and view your recent history.

Hot Features

Registration Strip Icon for default Register for Free to get streaming real-time quotes, interactive charts, live options flow, and more.

ETHUSD Faces Likely Retracement After Hitting Key Resistance Zone

Share On Facebook
share on Linkedin
Print

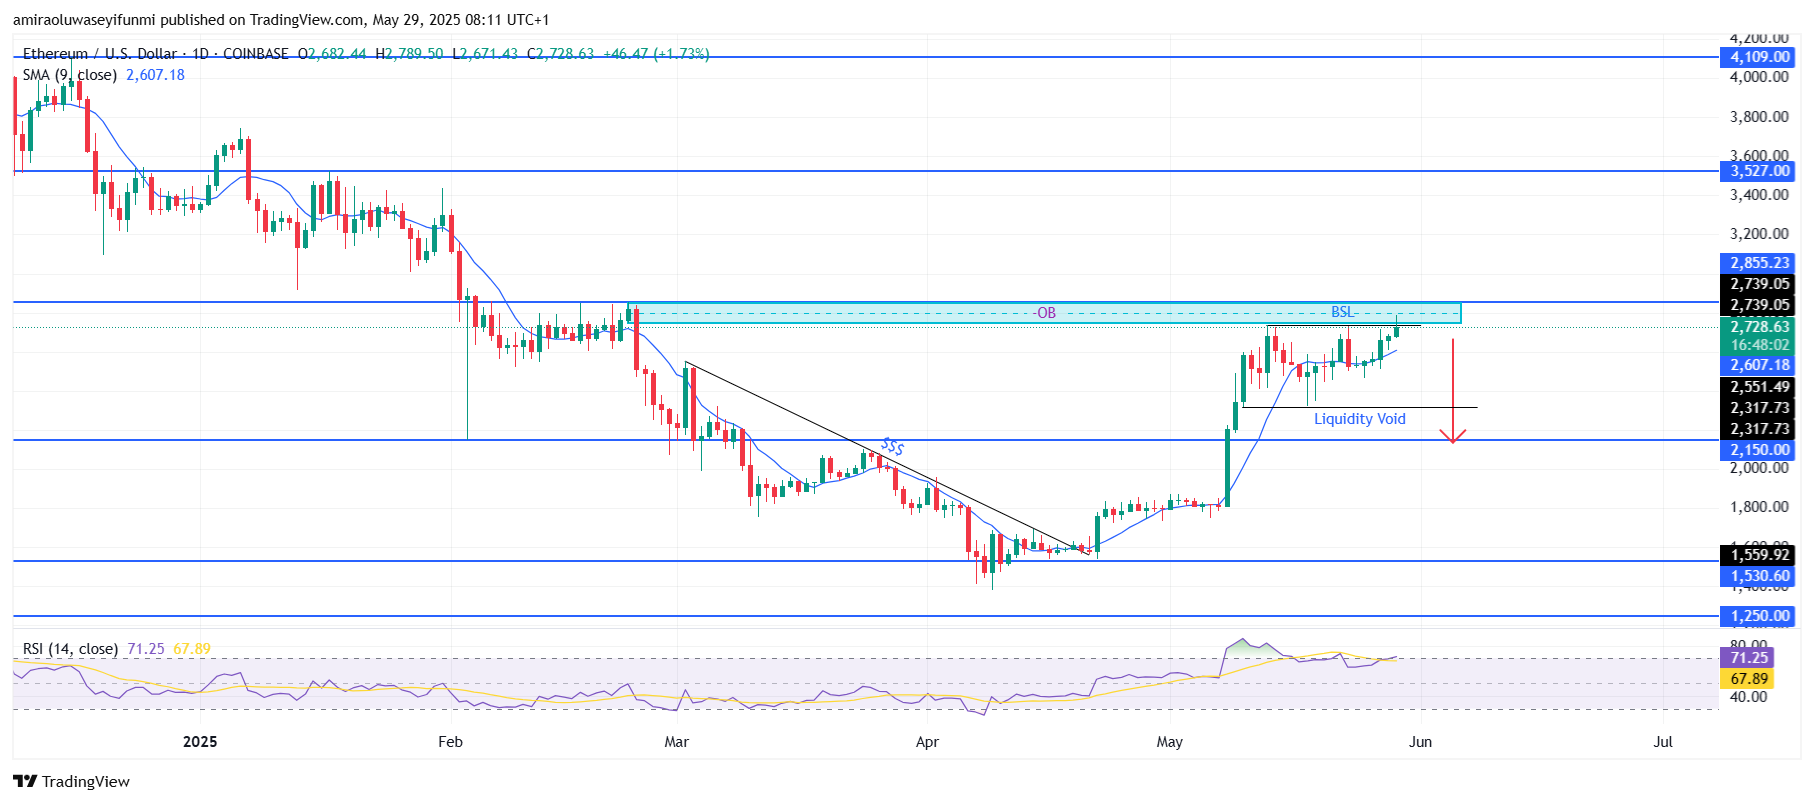
ETHUSD faces likely retracement after hitting the key resistance zone at $2860. Ethereum recently breached a prior high and swept the buy-side liquidity around $2,740, tagged within a marked order block zone. This key resistance aligns with the order block zone stretching from about $2,740 to $2,860. The bullish structure has been intact since the breakout above the descending trendline in April, but the current structure suggests a possible exhaustion as price consolidates below resistance. A liquidity void is clearly identified between the $2,550 and $2,320 zones, indicating a clean inefficiency that price might seek to rebalance.

©

Given these signals, ETHUSD is likely to face a short-term pullback, potentially targeting the $2,550 support level initially. If bearish momentum increases, price could fill the liquidity void and descend further toward $2,320, where previous consolidation and demand exist. This retracement may be brief, as the broader structure remains bullish, and buyers may re-enter the market at these discounted levels. A rebound from $2,320 could set the stage for a renewed push toward $2,860 and possibly $3,530 in the medium term, but in the immediate future, a downside correction appears more probable.

ETHUSD Faces Likely Retracement After Hitting Key Resistance Zone

ETH Key Levels

Supply Levels: $2860, $4110, $4870
Demand Levels: $2150, $1530, $1250


What are the indicators saying?

The Relative Strength Index (RSI) currently sits around 71, suggesting that ETHUSD is in overbought territory and may face selling pressure soon. While the 9-day Simple Moving Average (SMA) at approximately $2,610 continues to slope upward, showing underlying bullish momentum, the price is significantly extended above this moving average. This gap often signals a potential mean reversion, especially when paired with overbought RSI conditions.

Learn from market wizards: Books to take your trading to the next level


CLICK HERE TO REGISTER FOR FREE ON ADVFN, the world's leading stocks and shares information website, provides the private investor with all the latest high-tech trading tools and includes live price data streaming, stock quotes and the option to access 'Level 2' data on all of the world's key exchanges (LSE, NYSE, NASDAQ, Euronext etc).

This area of the ADVFN.com site is for independent financial commentary. These blogs are provided by independent authors via a common carrier platform and do not represent the opinions of ADVFN Ltd. ADVFN Ltd does not monitor, approve, endorse or exert editorial control over these articles and does not therefore accept responsibility for or make any warranties in connection with or recommend that you or any third party rely on such information. The information available at ADVFN.com is for your general information and use and is not intended to address your particular requirements. In particular, the information does not constitute any form of advice or recommendation by ADVFN.COM and is not intended to be relied upon by users in making (or refraining from making) any investment decisions. Authors may or may not have positions in stocks that they are discussing but it should be considered very likely that their opinions are aligned with their trading and that they hold positions in companies, forex, commodities and other instruments they discuss.

Comments are closed

 
Do you want to write for our Newspaper? Get in touch: newspaper@advfn.com