Hot Features

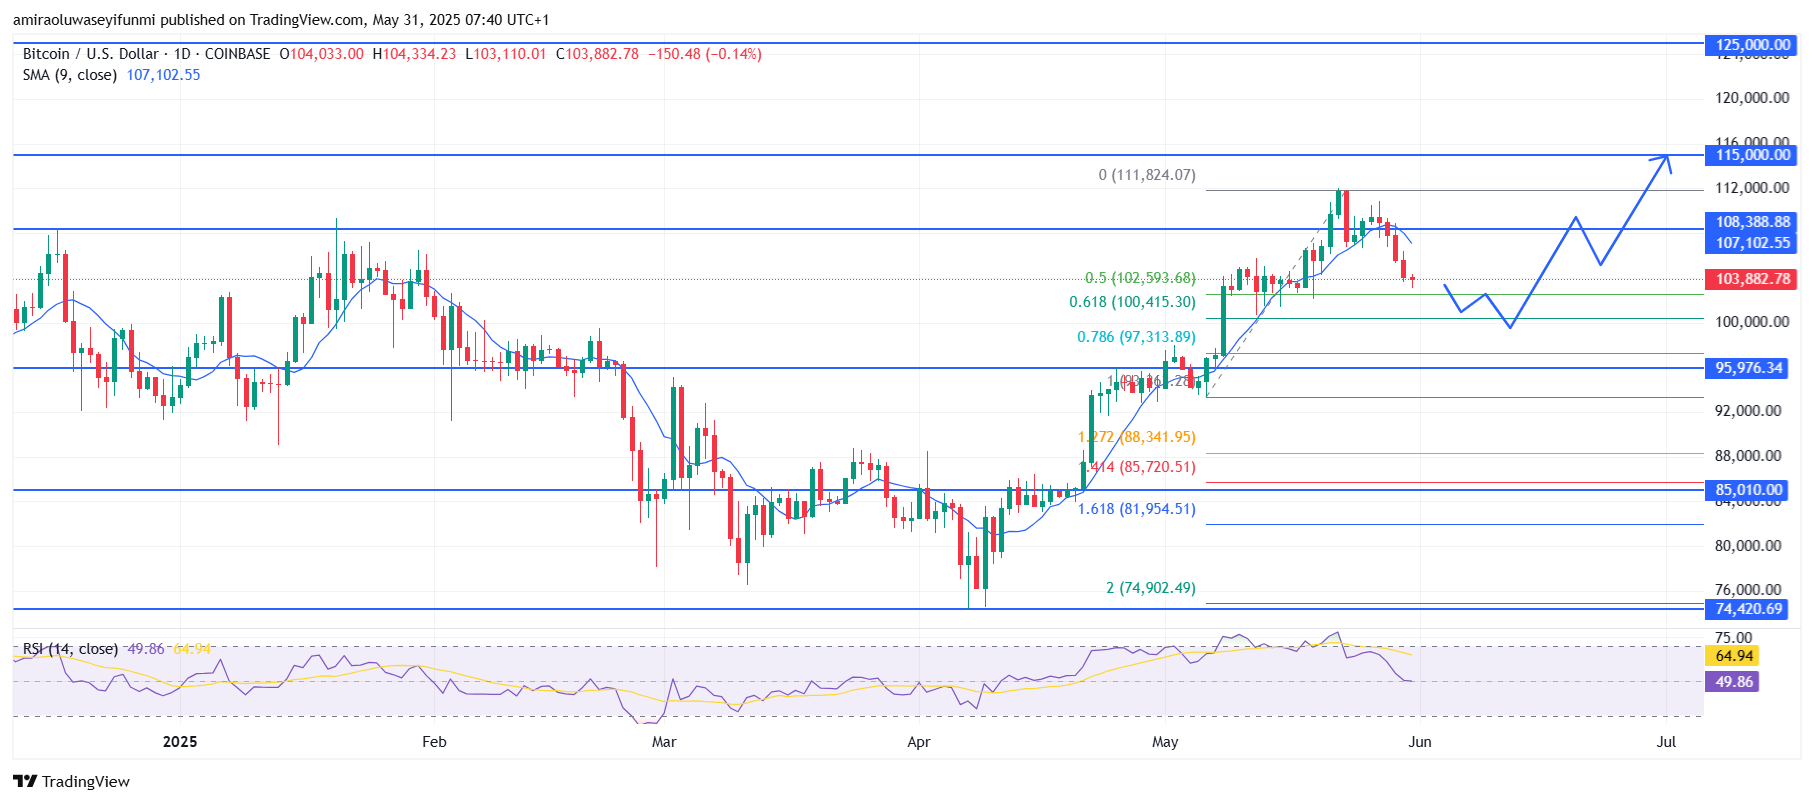
BTCUSD overall trend remains bullish amidst ongoing pullback. Price action on the chart confirms that BTCUSD recently climbed to approximately $111,820 before encountering resistance. Since then, the pair dipped below $108,390 and is now trading near $103,880, testing demand at the mid-Fibonacci levels. Despite this pullback, the formation of higher lows—visible from recent swings—demonstrates underlying buyer interest.

Support at the 61.8% Fibonacci level is crucial; if bulls defend this region, it would validate the uptrend. On the flipside, the broader structure remains intact as long as price stays above the former resistance zone near $95,980. A successful break above $108,390 would open the door for a retest of $111,820. Should momentum remain strong, the next upside targets are approximately $115,000 and, in an extended scenario, $125,000. Consolidation above $100,000 may precede the next impulse leg, reinforcing the overall bullish bias.
BTC Key Levels
Supply Levels: $108,390, 115,000, $125,000
Demand Levels: $95,980, $85,010, $74,420
 What are the indicators saying?
The daily indicators for BTCUSD point toward a continued bullish outlook. The Relative Strength Index (RSI) sits around 50, suggesting that momentum is neutral but primed for acceleration. The 9-day Simple Moving Average (SMA) hovers near $107,100, slightly above current trading levels, indicating short-term overhead pressure but also offering a reference point for any bullish reclaim.
Additionally, Fibonacci retracement levels from the recent swing low to swing high highlight key areas of support. The 50% retracement at roughly $102,600, the 61.8% level around $100,410, and the 78.6% level near $97,310 all represent zones where buyers have historically re-entered, reinforcing the bullish narrative if price holds above these thresholds.
Learn from market wizards: Books to take your trading to the next level