Hot Features

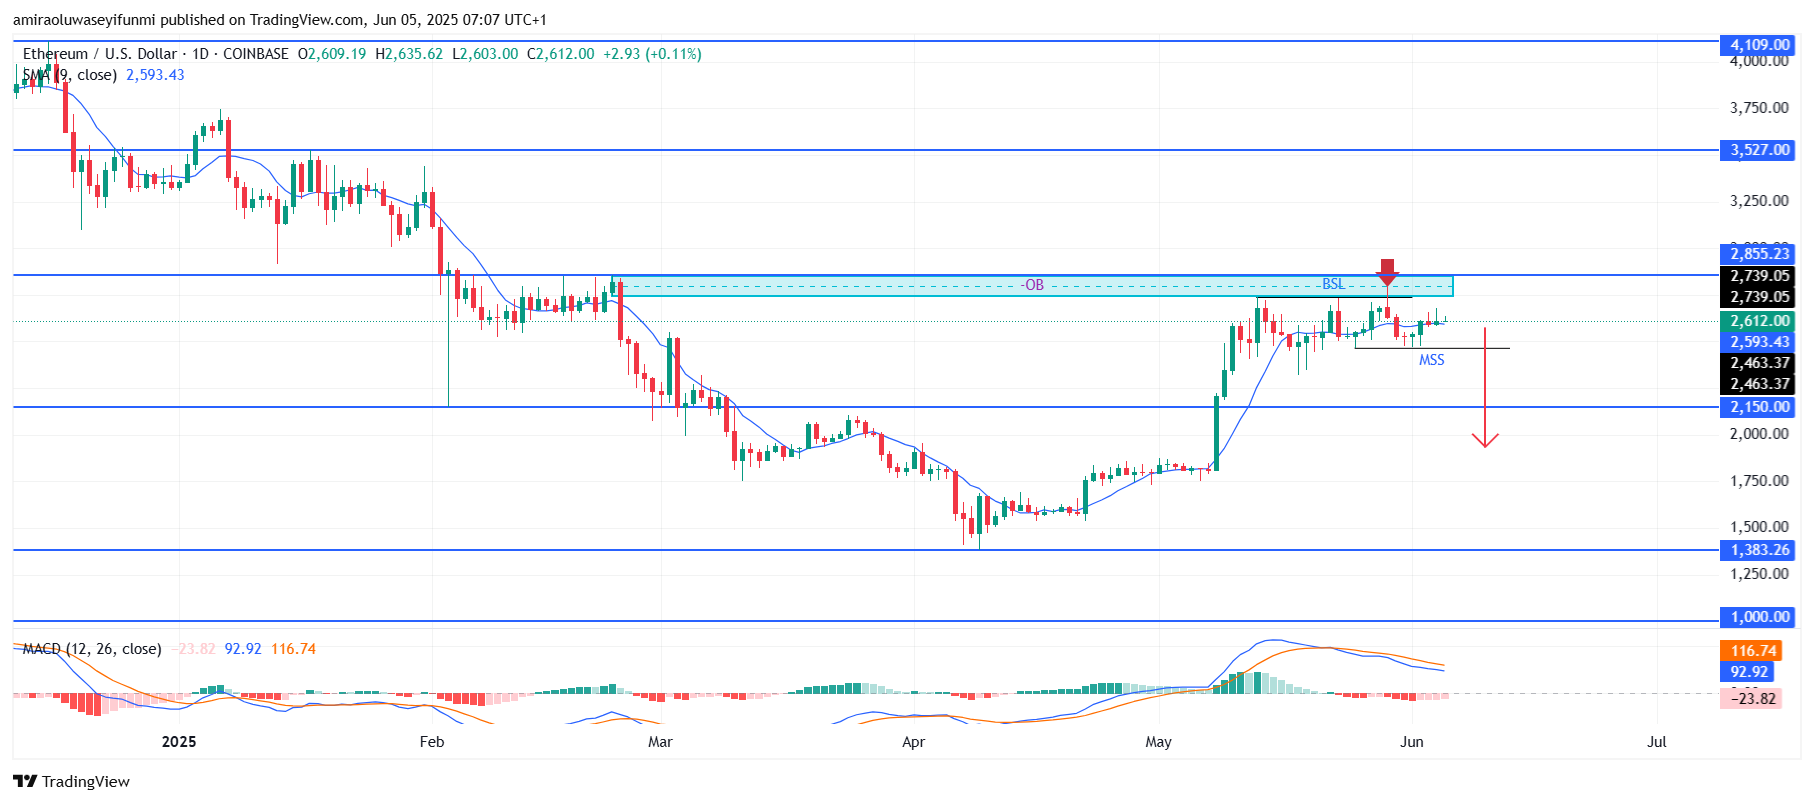
ETHUSD rejects resistance as bearish momentum builds for a breakout. Ethereum recently swept above the $2,740 swing high, taking out the buy-side liquidity (BSL), only to face a strong rejection within the order block zone capped at $2,860. This fakeout, followed by a pullback below the resistance, suggests a classic liquidity grab, often preceding bearish reversals. The formation of a market structure shift (MSS) beneath $2,610 further underscores seller dominance, as price failed to sustain higher highs and instead formed a lower low. The price has since struggled to break back above $2,740, reinforcing that supply is now controlling the market structure.

Given the rejection at the $2,860 order block and confirmation of a market structure break, the projection for ETHUSD remains to the downside. If bearish pressure persists, the next downside target lies at $2,150. A daily close below $2,460 would solidify the bearish narrative, opening the door toward deeper downside levels such as $1,380. With momentum indicators deteriorating and price action confirming distribution, ETHUSD appears poised for further decline unless bulls are convinced to reclaim the $2,860 supply zone.
ETH Key Levels
Supply Levels: $2860, $3530, $4110
Demand Levels: $2150, $1380, $1000
 What are the indicators saying?
Technical indicators on the daily ETHUSD chart suggest weakening bullish momentum and a tilt toward bearish control. The MACD (Moving Average Convergence Divergence) has crossed bearishly, with the signal line now trading above the MACD line. Additionally, the 9-day SMA (Simple Moving Average) at $2,590, while still below the current price, is beginning to flatten out, indicating a loss of upside strength. The price’s inability to sustain a move above the key resistance affirms the bearish bias, as momentum oscillators show fading strength near recent highs.
Learn from market wizards: Books to take your trading to the next level