ADVFN ADVFN

We could not find any results for:
Make sure your spelling is correct or try broadening your search.

Trending Now

Toplists

It looks like you aren't logged in.
Click the button below to log in and view your recent history.

Hot Features

Registration Strip Icon for pro Trade like a pro: Leverage real-time discussions and market-moving ideas to outperform.

Bitcoin (BTCUSD) Is Set for a Bullish Breakout as Momentum Builds Up

Share On Facebook
share on Linkedin
Print

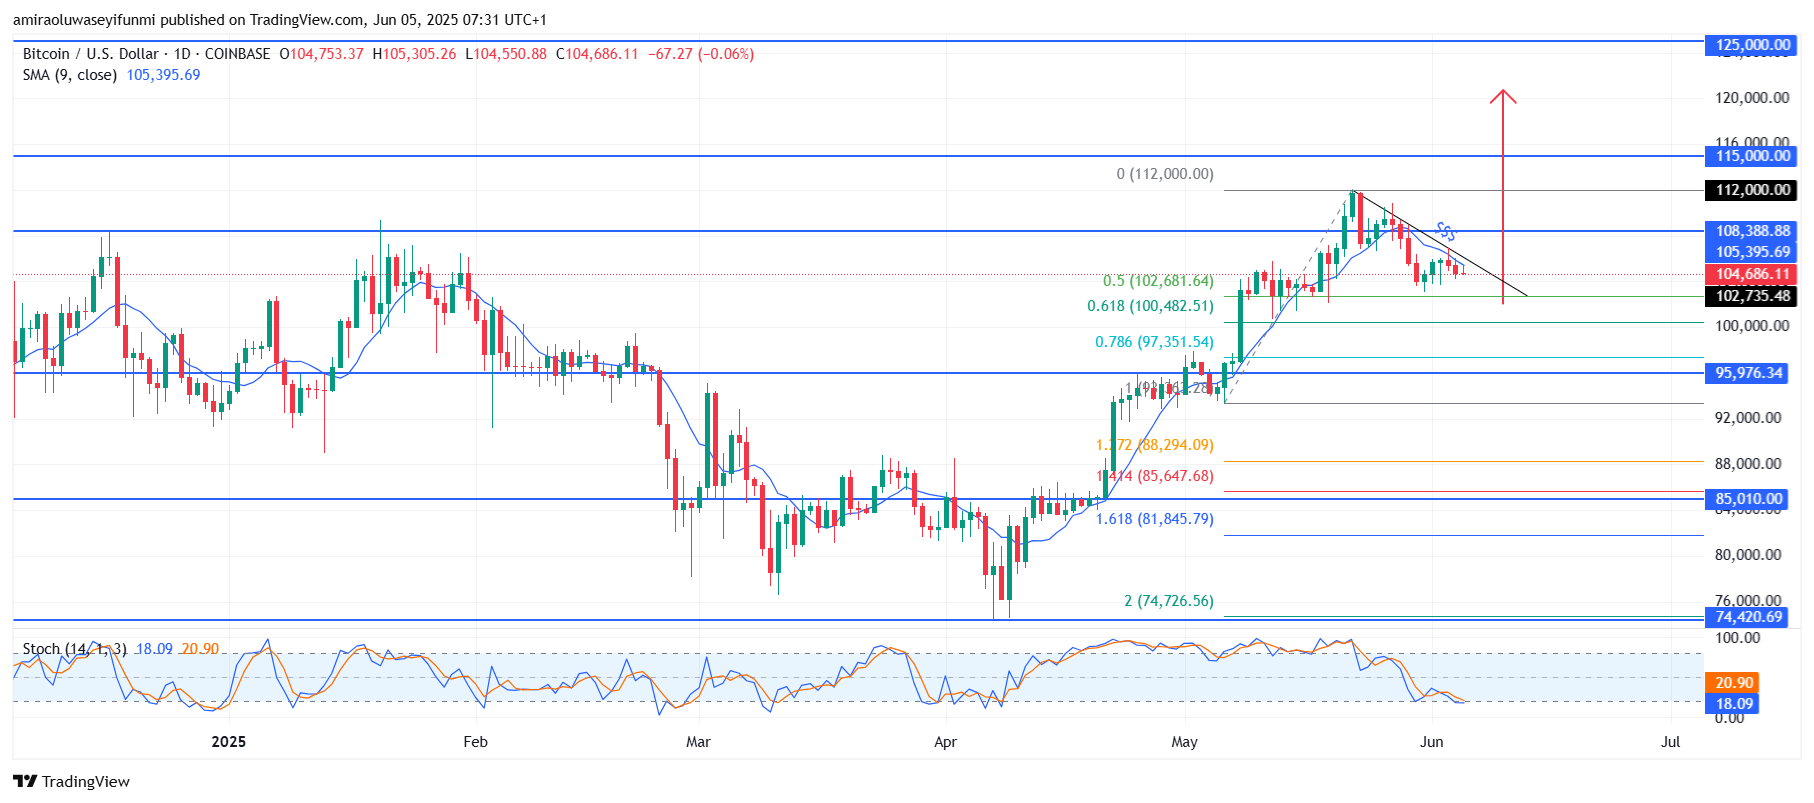
BTCUSD is set for a bullish breakout as momentum builds up. BTCUSD has been consolidating just above the $102,730 level, which aligns closely with the 0.5 Fibonacci retracement level from the previous rally. Price action also shows a descending trendline forming a bull flag pattern, which is typically a continuation setup. The bulls have defended the $100,480 support area well, and the structure suggests a tightening range ready to break to the upside.

©

Notably, the previous swing high near $108,390 remains the immediate resistance to watch, as a daily close above it would mark a new leg up. If BTCUSD breaks out of the current consolidation and clears the $108,390 resistance, the next bullish targets would lie at $112,000 and $115,000. A strong surge could eventually lead prices toward the major psychological level at $125,000, where sellers are likely to re-enter. On the downside, a drop below $100,480 would delay this bullish scenario, potentially pushing BTCUSD back to $97,350 or even $95,980.

Bitcoin (BTCUSD) set for bullish breakout as momentum builds upBTC Key Levels

Supply Levels: $108,390, 115,000, $125,000
Demand Levels: $100,480, $95,980, $85,010

What are the indicators saying?

The Stochastic RSI at the bottom of the chart is currently oversold, with values near 18 and 21, suggesting that selling pressure is fading and a reversal may be imminent. This oversold condition indicates a potential bullish turnaround, especially if the %K line crosses above the %D line.

Additionally, the price is sitting just below the 9-day Simple Moving Average (SMA), which is currently around $105,400. A breakout above this level would serve as an early confirmation of renewed upward momentum. The indicators collectively hint at a possible bullish continuation after this short consolidation phase.


Learn from market wizards: Books to take your trading to the next level


CLICK HERE TO REGISTER FOR FREE ON ADVFN, the world's leading stocks and shares information website, provides the private investor with all the latest high-tech trading tools and includes live price data streaming, stock quotes and the option to access 'Level 2' data on all of the world's key exchanges (LSE, NYSE, NASDAQ, Euronext etc).

This area of the ADVFN.com site is for independent financial commentary. These blogs are provided by independent authors via a common carrier platform and do not represent the opinions of ADVFN Ltd. ADVFN Ltd does not monitor, approve, endorse or exert editorial control over these articles and does not therefore accept responsibility for or make any warranties in connection with or recommend that you or any third party rely on such information. The information available at ADVFN.com is for your general information and use and is not intended to address your particular requirements. In particular, the information does not constitute any form of advice or recommendation by ADVFN.COM and is not intended to be relied upon by users in making (or refraining from making) any investment decisions. Authors may or may not have positions in stocks that they are discussing but it should be considered very likely that their opinions are aligned with their trading and that they hold positions in companies, forex, commodities and other instruments they discuss.

Comments are closed

 
Do you want to write for our Newspaper? Get in touch: newspaper@advfn.com