Hot Features

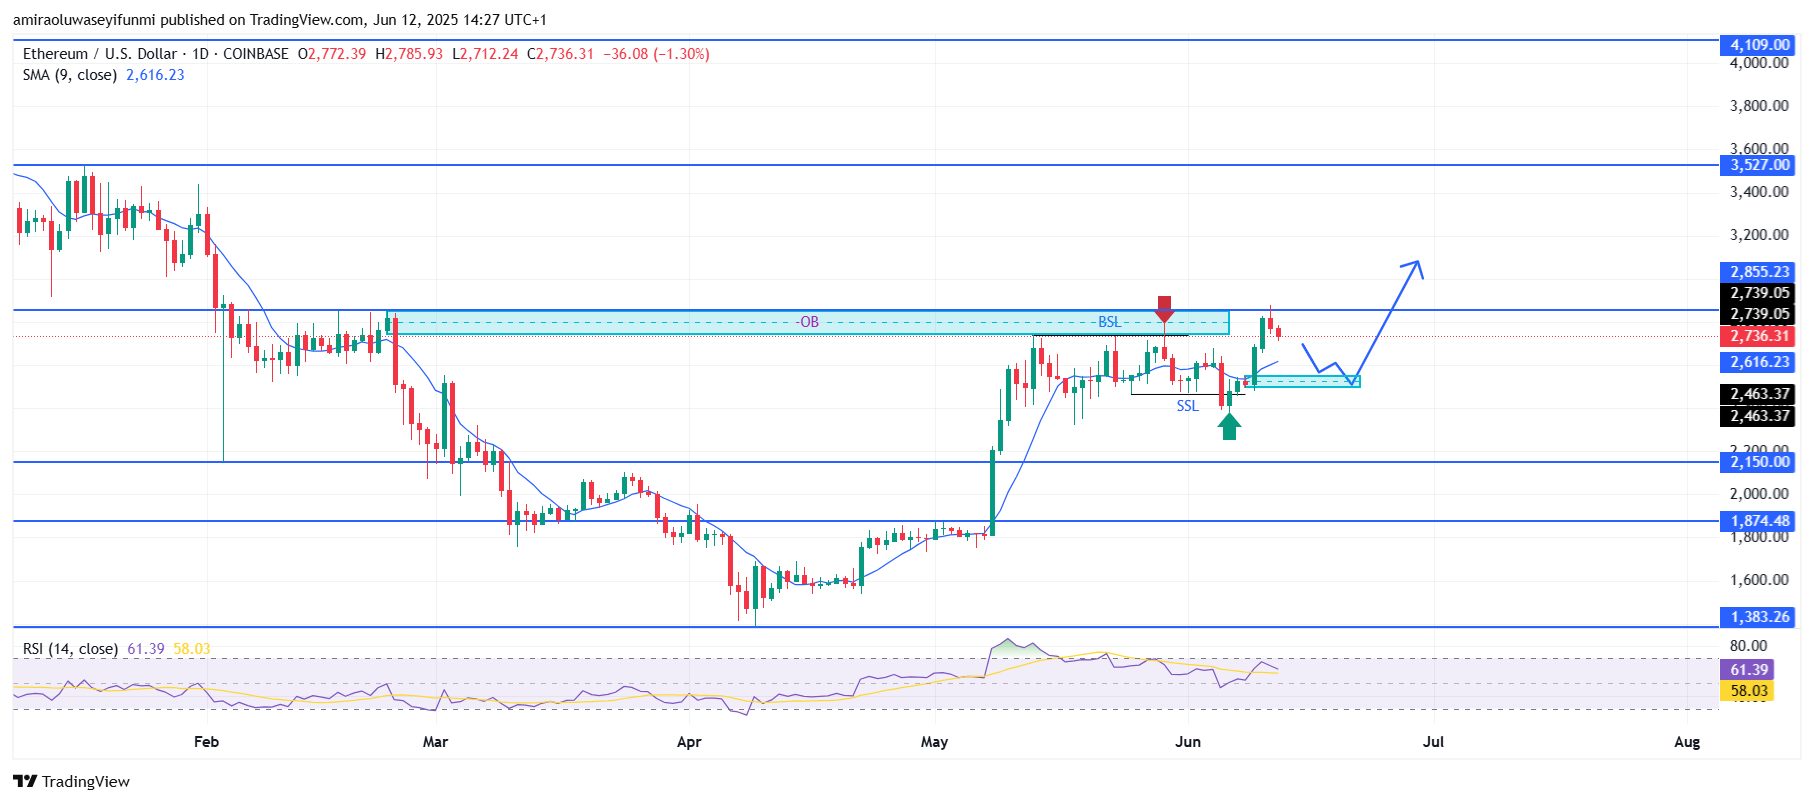
ETHUSD maintains a bullish posture after reclaiming key resistance zones. From a technical standpoint, price has decisively breached a former range high around $2,620, flipping it into a support base after sweeping the sell-side liquidity (SSL) earlier in June. A minor pullback was observed at the $2,860 order block (OB), coinciding with a mitigation of buy-side liquidity (BSL) and a short-term rejection. However, ETHUSD found support just above the former resistance at $2,620, forming a short-term bullish continuation pattern. Market structure remains intact with a higher low confirmed and higher highs anticipated should price maintain above this reclaimed zone.
The prevailing market structure suggests a bullish continuation scenario toward $2,860 and potentially extending into the $3,530 region over the medium term. Short-term fluctuations are expected within the $2,620 to $2,740 bracket, where price could establish a base of reaccumulation before initiating another leg upward. A break and hold above $2,860 would confirm strength and open the pathway to retest multi-month highs around $3,530. In the event of a short-term retracement, downside buffers exist near $2,460, but only a decisive breach below this level would challenge the current bullish projection.
ETH Key Levels
Supply Levels: $2860, $3530, $4110
Demand Levels: $2150, $1880, $1380
What are the indicators saying?
The broader trajectory of ETHUSD continues to reflect strength, underpinned by bullish market structure and supportive indicators. The price remains above the 9-day simple moving average (SMA) at approximately $2,620, suggesting sustained upside momentum. The Relative Strength Index (RSI) is currently reading near 61, signalling favourable buying interest without tipping into overbought territory. Together, these technical indicators validate a bullish bias as Ethereum consolidates above previous resistance levels.
Learn from market wizards: Books to take your trading to the next level