ADVFN ADVFN

We could not find any results for:
Make sure your spelling is correct or try broadening your search.

Trending Now

Toplists

It looks like you aren't logged in.
Click the button below to log in and view your recent history.

Hot Features

Registration Strip Icon for tools Level up your trading with our powerful tools and real-time insights all in one place.

Ethereum (ETHUSD) Displays Renewed Downward Momentum After Structural Breakdown

Share On Facebook
share on Linkedin
Print

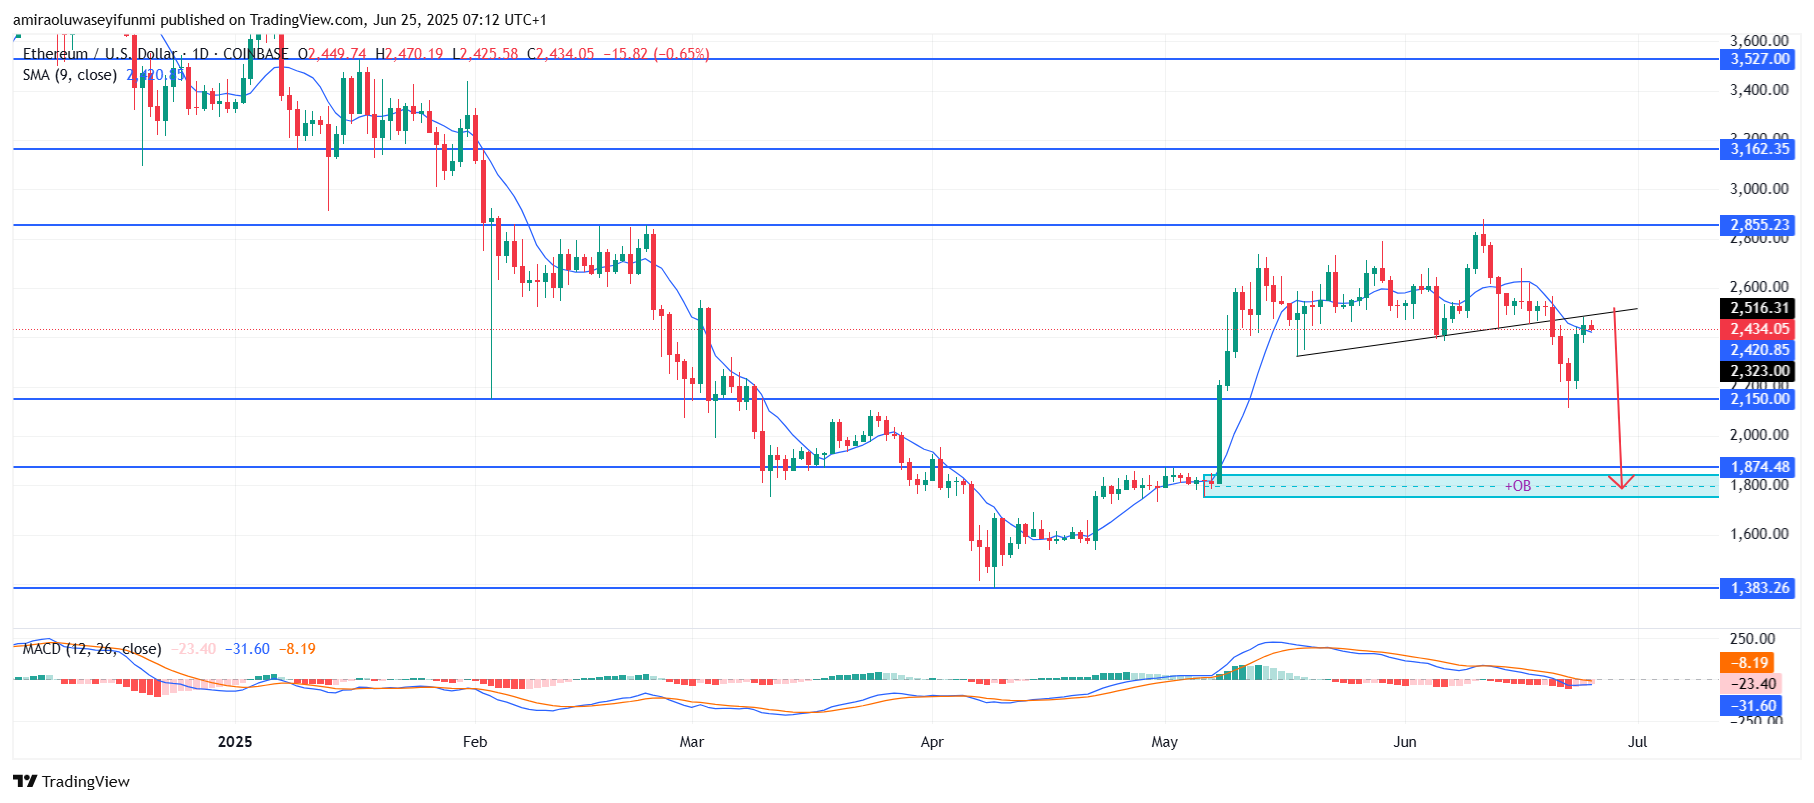
ETHUSD displays renewed downward momentum after structural breakdown. Ethereum has invalidated its short-term ascending structure following a sharp breakdown below the previous trendline support. Price is currently hovering around $2,430 after retesting this breakdown point, failing to sustain above $2,510 and forming bearish rejection wicks. The market structure is now clearly shifting toward a series of lower highs and lower lows, affirming a technical reversal from the late May bullish rally.

Looking forward, the price action suggests ETHUSD is likely to retrace further toward the $1,880 demand zone, marked by a previous order block and liquidity cluster. A clean break below the intermediate support at $2,150 would accelerate this move, exposing Ethereum to the $1,870–$1,800 region, where buying interest may re-emerge. Until price reclaims and consolidates above $2,510, the bears are expected to retain directional control, with rallies likely to be sold into.

COINBASE:ETHUSD Chart Image by amiraoluwaseyifunmiETH Key Levels

Supply Levels: $2860, $3160, $3530
Demand Levels: $2150, $1880, $1380

What are the indicators saying?

The current trajectory of ETHUSD reflects a distinct bearish sentiment, reinforced by confluence across technical indicators and price structure. The 9-day Simple Moving Average (SMA) is sloping downward and currently rests above the price around $2,450, indicating sustained selling pressure. The Moving Average Convergence Divergence (MACD) indicator shows widening negative histogram bars with both signal and MACD lines positioned below the zero axis. This alignment confirms that the recent breakdown was not an anomaly but part of a broader directional shift.

Learn from market wizards: Books to take your trading to the next level


CLICK HERE TO REGISTER FOR FREE ON ADVFN, the world's leading stocks and shares information website, provides the private investor with all the latest high-tech trading tools and includes live price data streaming, stock quotes and the option to access 'Level 2' data on all of the world's key exchanges (LSE, NYSE, NASDAQ, Euronext etc).

This area of the ADVFN.com site is for independent financial commentary. These blogs are provided by independent authors via a common carrier platform and do not represent the opinions of ADVFN Ltd. ADVFN Ltd does not monitor, approve, endorse or exert editorial control over these articles and does not therefore accept responsibility for or make any warranties in connection with or recommend that you or any third party rely on such information. The information available at ADVFN.com is for your general information and use and is not intended to address your particular requirements. In particular, the information does not constitute any form of advice or recommendation by ADVFN.COM and is not intended to be relied upon by users in making (or refraining from making) any investment decisions. Authors may or may not have positions in stocks that they are discussing but it should be considered very likely that their opinions are aligned with their trading and that they hold positions in companies, forex, commodities and other instruments they discuss.

Comments are closed

 
Do you want to write for our Newspaper? Get in touch: newspaper@advfn.com