Hot Features

On Wednesday, the US energy department released data showing that US oil stockpiles had risen to 8.2m barrels – a ninth consecutive monthly increase. This, combined with Saudi Arabia’s energy minister stating that the OPEC production cut was reinvigorating US shale rivals sent the Crude price plummeting.
Prices fell 4.5% breaking lower from a prolonged period of range compression, printing its second largest range of 2017. With crude subsequently continuing to fall, let’s take a look and see if this selloff signals the end of oil’s 2016/17 recovery.
Oil’s 2016/17 recovery
A raft of production outages in 2016 helped ease oil’s supply glut and drove prices higher for the first half of the year. However, with the industry still plagued by rising US shale production this rally was tempered and Crude twice found resistance around the $53 mark.
In December prices broke above the $52.7 – $53.7 resistance zone following a Saudi Arabia led OPEC production cut. In turn, the $52.7 – $53.7 resistance turned support. Crude finding support at this level no less than four times in the following two months highlights the strength of this key structural level.
At the time many, thought the OPEC production cut led bullish burst would pave the way for a new trend leg to form. On the back of this we saw hedge funds amass the biggest ever bet on rising oil prices.
However, a combination of dollar strength, a continued rise in shale production and scepticism regarding production cut compliance meant prices failed kick on. Instead, we saw prices trade in a historically tight range and as per the below chart a ‘wedge’ pattern form.
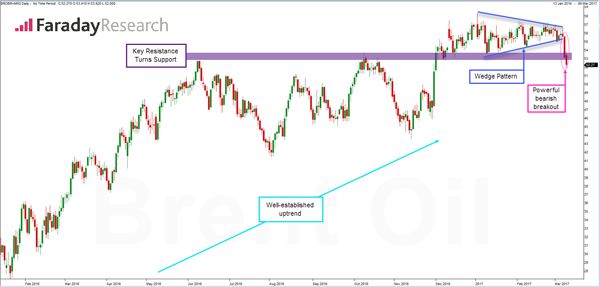
Brent Crude 1y Daily Candle Chart
Have we seen the top?
Crude’s selloff sees prices break below the lows of the $52.7 to $53.7 support zone. Any break and hold below this key level would represent a clear change in market structure and in turn set the scene for a down leg to form. Notably the next structural price level is some way away.
Of course, were Brent to fight back, then this would see a false break of the $52.7 to $53.7 support zone. This in itself is a bullish sign as it would further reinforce the significance of this key support level. In this case, it would clear the path for Crude to rally back within its previous consolidation range, or at the very least consolidate around $53.
With this in mind, investors (like us) should follow Crude’s price action in the short term very closely.
Faraday Research offers real time FX and Equity trade signals from qualified analysts. Click here to try us free.