Solana Active Addresses Surge To 832K Per Hour Outpacing Ethereum Amid TRUMP Meme Coin Hype
27 January 2025 - 12:00AM
NEWSBTC
Solana has been navigating a highly volatile market environment
ever since the launch of the TRUMP meme coin, which has brought
unprecedented attention to its ecosystem. Price action has been
erratic, leaving many investors uncertain about the network’s
short-term direction. While some are predicting a broader market
retrace, the Solana ecosystem’s underlying metrics tell a different
story of growth and resilience. Related Reading: Ethereum Whales
Keep Buying As Price Struggles – Expert Discloses Massive
Accumulation According to key data from Glassnode, the TRUMP meme
coin launch has sparked a surge in activity within the Solana
network. The number of active addresses on Solana has skyrocketed,
reaching an impressive 832,000 addresses per hour. This is a
remarkable milestone, showcasing Solana’s ability to handle and
attract significant user engagement. This surge in activity
highlights Solana’s growing appeal as a go-to blockchain for
high-speed, high-volume applications, particularly in the meme coin
sector. As the market continues to speculate on Solana’s price
movements, its strong network fundamentals suggest a foundation
that could withstand current volatility and drive long-term growth.
Investors and analysts are closely watching whether this surge in
activity can sustain Solana’s momentum in the weeks ahead. Solana
Network Growing Fast After a period of market consolidation, Solana
remains strong, just below its all-time high, positioning itself as
a leading force poised for a massive rally. Analysts and investors
are closely monitoring Solana’s price action, anticipating that a
breakout into price discovery could serve as the catalyst for the
next altseason. As the debate around Solana versus Ethereum
intensifies, recent metrics reveal compelling insights into the
evolving dynamics between the two networks. Glassnode recently
shared a report on X that underscores Solana’s impressive network
activity, fueled in part by the launch of the TRUMP meme coin.
Since this event, the Solana ecosystem has seen a surge in user
engagement, with active addresses reaching an extraordinary 832,000
per hour. This figure dwarfs Ethereum’s activity, which currently
averages just 31,000 active addresses per hour—a stark contrast
highlighting a significant shift in user focus toward Solana. This
data not only showcases Solana’s scalability and capacity to handle
high transaction volumes but also cements its reputation as a
preferred network for emerging projects, particularly in the meme
coin sector. As investors continue to assess Solana’s potential,
its robust fundamentals and growing ecosystem suggest it is
well-equipped to lead the next phase of market growth. Related
Reading: Cardano Consolidates In A Symmetrical Triangle – Analyst
Expects A 40% Move If Solana manages to break past its all-time
high and enter price discovery, it could ignite widespread
enthusiasm across the altcoin market. With strong user activity and
a growing base of developers and projects, Solana appears ready to
solidify its position as a major player in the cryptocurrency
space, rivaling Ethereum’s dominance. The coming weeks will be
crucial as Solana strives to maintain its momentum and deliver on
investor expectations. Price Action Details: Key Supply
Levels Solana (SOL) is currently trading at $256, maintaining
its position above a key demand level that has provided strong
support in recent sessions. This resilience has kept bullish
sentiment intact, with traders eyeing further upside potential.
However, the focus now shifts to critical supply zones,
particularly at $266 and Solana’s all-time high (ATH) of $295. A
successful push above $266 could act as a stepping stone for SOL to
retest its ATH, signaling renewed momentum and attracting further
buying interest. Breaking and holding above $295 would not only
confirm the bullish trend but also likely send Solana into price
discovery, potentially igniting enthusiasm across the altcoin
market. Despite the promising outlook, maintaining support above
$240 remains crucial for sustaining the bullish thesis. Losing this
level could trigger increased selling pressure, potentially pushing
Solana into a deeper consolidation or correction phase. Such a move
would challenge the current upward momentum and dampen short-term
investor sentiment. Related Reading: XRP Forms A Bullish Pattern In
4-Hour Chart – Analyst Expects $4.20 After Breakout For now, Solana
appears well-positioned to continue its upward trajectory, provided
bulls can defend key levels and reclaim important supply zones. The
next few trading sessions will be pivotal in determining whether
SOL can sustain its rally and deliver on the market’s optimistic
expectations. Featured image from Dall-E, chart from TradingView
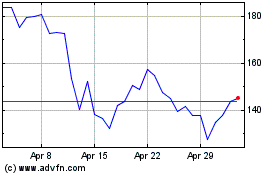
Solana (COIN:SOLUSD)
Historical Stock Chart
From Dec 2024 to Jan 2025

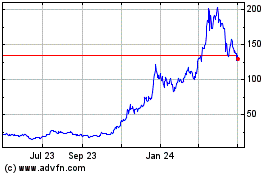
Solana (COIN:SOLUSD)
Historical Stock Chart
From Jan 2024 to Jan 2025
