UNITED STATES
SECURITIES AND EXCHANGE COMMISSION
Washington, D.C. 20549
FORM 6-K
REPORT OF FOREIGN
PRIVATE ISSUER PURSUANT TO RULE 13a-16 OR 15d-16 UNDER THE SECURITIES EXCHANGE ACT OF 1934
For the month of December 2023
Commission File Number: 001-39155
XP Inc.
(Exact name of registrant as specified in its
charter)
20, Genesis Close
Grand Cayman, George Town
Cayman Islands KY-1-1208
+55 (11) 3075-0429
(Address of principal executive office)
Indicate by check mark whether the registrant files
or will file annual reports under cover of Form 20-F or Form 40-F:
Indicate by check mark if the registrant is submitting
the Form 6-K in paper as permitted by Regulation S-T Rule 101(b)(1):
Indicate by check mark if the registrant is submitting
the Form 6-K in paper as permitted by Regulation S-T Rule 101(b)(7):
SIGNATURE
Pursuant to the requirements of the Securities
Exchange Act of 1934, the registrant has duly caused this report to be signed on its behalf by the undersigned, thereunto duly authorized.
| |
|
XP Inc. |
| |
|
|
| |
|
|
| |
|
|
By: |
/s/ Bruno Constantino Alexandre dos Santos |
| |
|
|
|
Name: |
Bruno Constantino Alexandre dos Santos |
| |
|
|
|
Title: |
Chief Financial Officer |
Date: December 8, 2023
EXHIBIT INDEX
| Exhibit No. |
Description |
| 99.1 |
Presentation dated December 8, 2023 – XP Inc. Investor Day. |
Exhibit 99.1

1

2 Welcome Andre Parize Head of Investor Relations
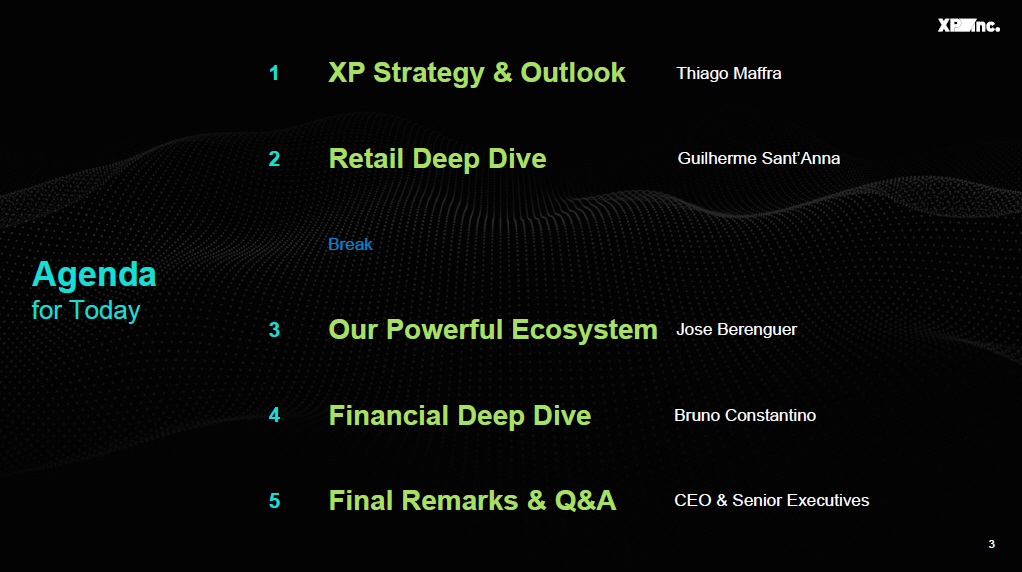
3 Agenda for Today Break Final Remarks & Q&A CEO & Senior Executives 5 Financial Deep Dive Bruno Constantino 4 Our Powerful Ecosystem Jose Berenguer 3 Retail Deep Dive Guilherme Sant’Anna 2 XP Strategy & Outlook Thiago Maffra 1

4 Important Disclosure Forward Looking Statements IN REVIEWING THE INFORMATION CONTAINED HEREIN, YOU ARE AGREEING TO ABIDE BY THE TERMS OF THIS DISCLAIMER. THIS INFORMATION IS BE ING MADE AVAILABLE TO EACH RECIPIENT SOLELY FOR ITS INFORMATION AND IS SUBJECT TO AMENDMENT. This material is prepared by XP Inc. (the “Company,” “we” or “our”), is solely for informational purposes. This material does no t constitute a prospectus and does not constitute an offer to sell or the solicitation of an offer to buy any securities. In add ition, this document and any materials distributed in connection herewith are not directed to, or intended for distribution to or use by, any pers on or entity that is a citizen or resident or located in any locality, state, country or other jurisdiction where such distribut ion , publication, availability or use would be contrary to law or regulation or which would require any registration or licensing within such jurisdiction. Neither the Company nor any of its affiliates, officers, employees or agents, make any representation or warranty, express or im plied, in relation to the fairness, reasonableness, adequacy, accuracy or completeness of the information, statements or opin ion s, whichever their source, contained herein or any oral information provided in connection herewith, or any data it generates an d a ccept no responsibility, obligation or liability (whether direct or indirect, in contract, tort or otherwise) in relation to any of such information. The information and opinions contained herein are provided as at the date hereof, are subject to change without notice and do no t purport to contain all information that may be required to evaluate the Company. The information herein is in draft form an d h as not been independently verified. The Company and its affiliates, officers, employees and agents expressly disclaim any and all li abi lity which may be based hereon and any errors therein or omissions therefrom. Neither the Company nor any of its affiliates, off icers, employees or agents makes any representation or warranty, express or implied, as to the achievement or reasonableness of futu re projections, management targets, estimates, prospects or returns, if any. The information contained herein does not purport to be comprehensive and has not been subject to any independent audit or re vie w. Certain of the financial information as of and for the periods ended December 31, 2022, 2021, 2020 and 2019 has been deriv ed from audited financial statements and all other financial information has been derived from unaudited interim financial state men ts. A significant portion of the information contained herein is based on estimates or expectations of the Company, and there ca n be no assurance that these estimates or expectations are or will prove to be accurate. The Company’s internal estimates have not be en verified by an external expert, and the Company cannot guarantee that a third party using different methods to assemble, anal yze or compute market information and data would obtain or generate the same results. Statements in the presentation, including those regarding the possible or assumed future or other performance of the Company or its industry or other trend projections, constitute forward - looking statements. These statements are generally identified by the use of words such as “anticipate,” “believe,” “could,” “expect,” “should,” “plan,” “intend,” “estimate” and “potential,” among other s. By their nature, forward - looking statements are necessarily subject to a high degree of uncertainty and involve known and unknow n risks, uncertainties, assumptions and other factors because they relate to events and depend on circumstances that will occur in the fu ture whether or not outside the control of the Company. Such factors may cause actual results, performance or developments to di ffer materially from those expressed or implied by such forward - looking statements and there can be no assurance that such forward - lo oking statements will prove to be correct. These risks and uncertainties include those factors discussed herein and any repor t o n Form 6 - K or annual report on Form 20 - F, in each case, under the heading “Risk Factors,” and other documents of the Company filed, or to be filed, with the SEC. Accordingly, you should not place undue reliance on forward - looking statements. The forward - looking statements included herein speak only as at the date hereof and the Company does not undertake any obligation to update these fo rward - looking statements. Past performance does not guarantee or predict future performance. Moreover, the Company and its affiliates, officers, employees and agents do not undertake any obligation to review, update or confirm expectations or estim ate s or to release any revisions to any forward - looking statements to reflect events that occur or circumstances that arise in rela tion to the content of the presentation. You are cautioned not to unduly rely on such forward - looking statements when evaluating the informa tion presented and we do not intend to update any of these forward - looking statements. Market data and industry information used herein are based on management’s knowledge of the industry and the good faith estim ate s of management. The Company also relied, to the extent available, upon management’s review of industry surveys and publicati ons and other publicly available information prepared by a number of third party sources. All of the market data and industry inf orm ation used herein involves a number of assumptions and limitations, and you are cautioned not to give undue weight to such es tim ates. Although the Company believes that these sources are reliable, there can be no assurance as to the accuracy or completeness o f t his information, and the Company has not independently verified this information. The contents hereof should not be construed as investment, legal, tax or other advice and you should consult your own adviser s a s to legal, business, tax and other related matters concerning an investment in the Company. The Company is not acting on you r b ehalf and does not regard you as a customer or a client. It will not be responsible to you for providing protections afforded to cl ien ts or for advising you on any transaction. This material also includes certain non - GAAP financial information. We believe that such information is meaningful and useful in understanding the activities and business metrics of the Company’s operations. We also believe that these non - GAAP financial me asures reflect an additional way of viewing aspects of the Company’s business that, when viewed with our International Financial Rep ort ing Standards (“IFRS”) results, as issued by the International Accounting Standards Board, provide a more complete understand ing of factors and trends affecting the Company’s business. Further, investors regularly rely on non - GAAP financial measures to assess operating performance and such measures may highlight trends in the Company’s business that may not otherwise be apparent whe n relying on financial measures calculated in accordance with IFRS. We also believe that certain non - GAAP financial measures are f requently used by securities analysts, investors and other interested parties in the evaluation of public companies in the Co mpa ny’s industry, many of which present these measures when reporting their results. The non - GAAP financial information is presented for informational purposes and to enhance understanding of the IFRS financial statements. The non - GAAP measures should be considered in addition to results prepared in accordance with IFRS, but not as a substitute for, or superior to, IFRS results . A s other companies may determine or calculate this non - GAAP financial information differently, the usefulness of these measures f or comparative purposes is limited. A reconciliation of such non - GAAP financial measures to the nearest GAAP measure is included he rein. Certain terms used herein are used as defined in the glossary of terms included in our annual report on Form 20 - F.

XP Strategy & Outlook INVESTOR DAY XP INC. 2023 Thiago Maffra CEO
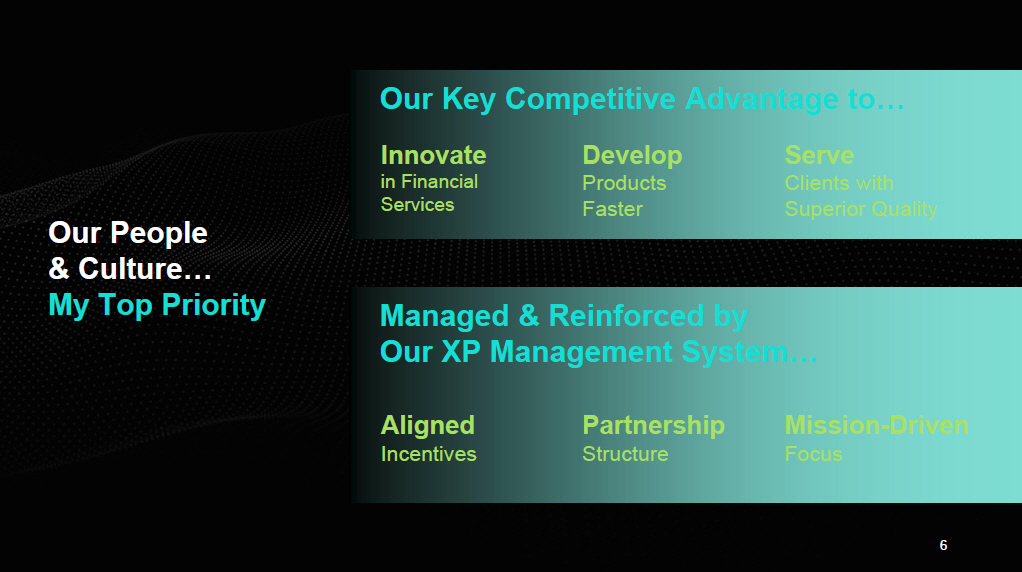
6 Our People & Culture… My Top Priority Our Key Competitive Advantage to… Innovate in Financial Services Develop Products Faster Serve Clients with Superior Quality Managed & Reinforced by Our XP Management System… Aligned Incentives Partnership Structure Mission - Driven Focus

7 • More Curated Client Approach for Investing • Better Aligned Incentives for Advisors • Smarter XP Apps • Grow Services for Corporate & SMB Clients • Better Business Solutions by Leveraging the XP Ecosystem Retail Investments 1 Retail Cross - Sell 2 Corporate & SMB 3 Higher Quality Advice Higher Quality Engagement Higher Quality Service Next Phase of Growth Based on Delivering a Higher Quality Experience End - to - End • Unlock Opportunity with Premium Clients • Better Product Bundling to Serve Across Client’s Financial Life

8 • More Curated Client Approach for Investing • Better Aligned Incentives for Advisors • Smarter XP Apps Retail Investments 1 Retail Cross - Sell 2 Corporate & SMB 3 Higher Quality Advice 3 Phases of Growth

9 3 Waves of Our Evolution XP Differentiation XP Evolution Over Time 2. Distribution First Open Platform Largest Reach & Channels Best Functionality & Experience Product Access Investor Education Client Acquisition Channel Diversification Specialized Advisors Superior Functionality Smarter Curated Advice Better Software & Apps Highest Quality Support 2009 2023 Evolving Beyond the Market to Differentiate with Higher Quality Services End - to - End
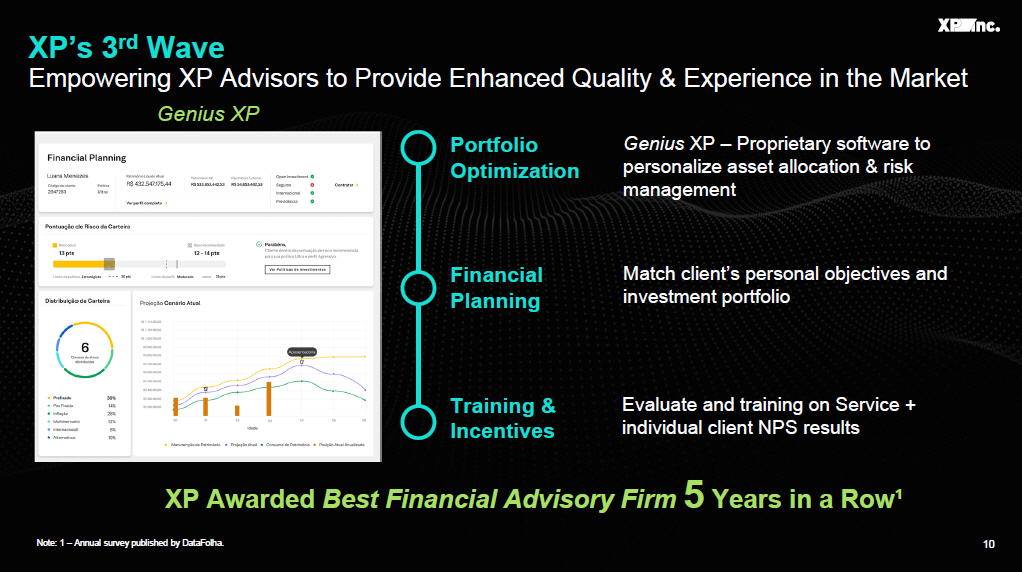
Genius XP – Proprietary software to personalize asset allocation & risk management Portfolio Optimization Financial Planning Training & Incentives XP’s 3 rd Wave Empowering XP Advisors to Provide Enhanced Quality & Experience in the Market Match client’s personal objectives and investment portfolio Evaluate and training on Service + individual client NPS results XP Awarded Best Financial Advisory Firm 5 Years in a Row¹ Genius XP 10 Note: 1 – Annual survey published by DataFolha .

11 3Q’19 @IPO 3Q’23 Current 3.1 x Client Assets 6.7 % 11.3 % + 460 bps Market Share 1 2.9 x Active Clients XP Invested to Scale & Expand Significantly Since the IPO R$ 350 Billion R$ 1,080 Billion 1.5 Million 4.4 Million Note: 1 – Investments for Individuals Market Share, according to Anbima (self - regulated capital markets entity in Brazil) data.
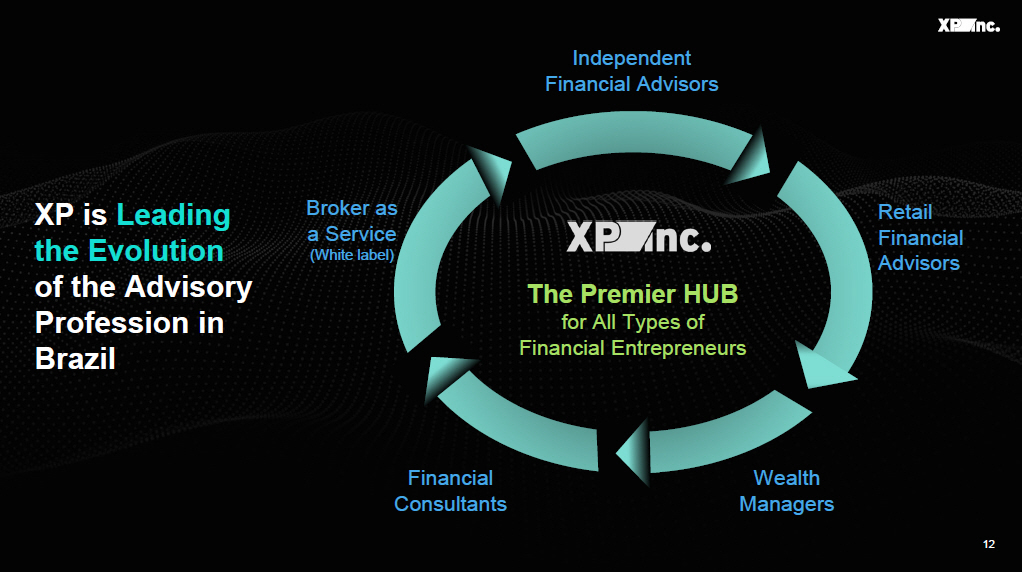
12 XP is Leading the Evolution of the Advisory Profession in Brazil Financial Consultants Wealth Managers Retail Financial Advisors Broker as a Service (White label) Independent Financial Advisors The Premier HUB for All Types of Financial Entrepreneurs

13 We Faced Significant Macro Headwinds... Note: 1 - Time Deposits + LCI + LCA per Central Bank Data; 2 - Includes Fixed Income, Equities and Multimarket Funds. 2,400,000,000 2,600,000,000 2,800,000,000 3,000,000,000 3,200,000,000 3,400,000,000 3,600,000,000 3,800,000,000 4,000,000,000 -400,000,000 -300,000,000 -200,000,000 -100,000,000 0 100,000,000 200,000,000 1Q22 2Q22 3Q22 4Q22 1Q23 2Q23 Accumulated Net Outflows from Funds² (R$ Bn) R$ 3.9 Tn R$ - 320 Bn R$ 2.8 Tn Time Deposits¹ (R$ Tn)

14 Expansion of Our Distribution Efficiency In Our Operations …We Weathered the Storm with a Combination of: x Empowerment of Our Advisors x Increasing Our Ability to Reach to Clients • Bigger Salesforce • More Advisor Channels ..and Positioning XP as a Stronger Company for the Next Cycle Providing Advisors with Better Software • Client Management • Portfolio Optimization Improving Our Internal Operations & Controls • Strict Cost Discipline • Enhanced Capital Allocation Processes

15 Our Ambition: Expand Our Leadership Even Further IPO 2019 3 Q23 2026 Growing XP Market Share 50 - 150bps Per Year 7 % 11 % Market Share Client Assets¹ Long - term Ambition 14 - 15 % + 2 x Note: 1 – Investments for Individuals Market Share, according to Anbima and Company data.

16 Retail Investments 1 Retail Cross - Sell 2 Corporate & SMB 3 Higher Quality Engagement • Unlock Opportunity with Premium Clients • Better Product Bundling to Serve Across Client’s Financial Life 3 Phases of Growth

17 Cross - Sale of New Verticals Will Continue to Grow Rapidly New Vertical Products • Retirement Plans • Cards • Loans • Insurance • FX • Digital Account • Global Investments • ...More to come R$ 0.1 bn 2019 3Q’23 LTM + 14 x R$ 1.8 bn Revenue from New Verticals¹ Note: 1 – Includes only Individuals.

18 Cross - Sell Reinforces Our Core Investments Credit Card XP Card Becomes Primary Credit Card ~ 4 Months Share of Wallet + 11 % NPS + 7 % Positive Feedback Loop as Investment Clients Adopt Credit Card Example: Note: Internal data as of September 30 th , 2023.

19 Cross - Sell Product Penetration Product Penetration % of Total Active Clients¹ Credit Cards 20 % Retirement Plans 5 % Primary Digital Accounts 2 % 1 % 1 % 1 % 1 % Global Investments FX Insurance Loans Attractive Retail Opportunity Increase Penetration in Cards Replicate Cards Penetration in Other New Products Note: 1 – Internal data as of September 30 th , 2023.

20 Our Goal for Cross - Sales¹: + R$ 2 - 3 Billion in Incremental Revenue 2019 3Q’23 LTM 2026 R$ 3.8 - 4.8 Bn x More Products x More Penetration x More Reinforcement R$ 0.1 bn R$ 1.8 bn Note: 1 – Includes only Individuals.
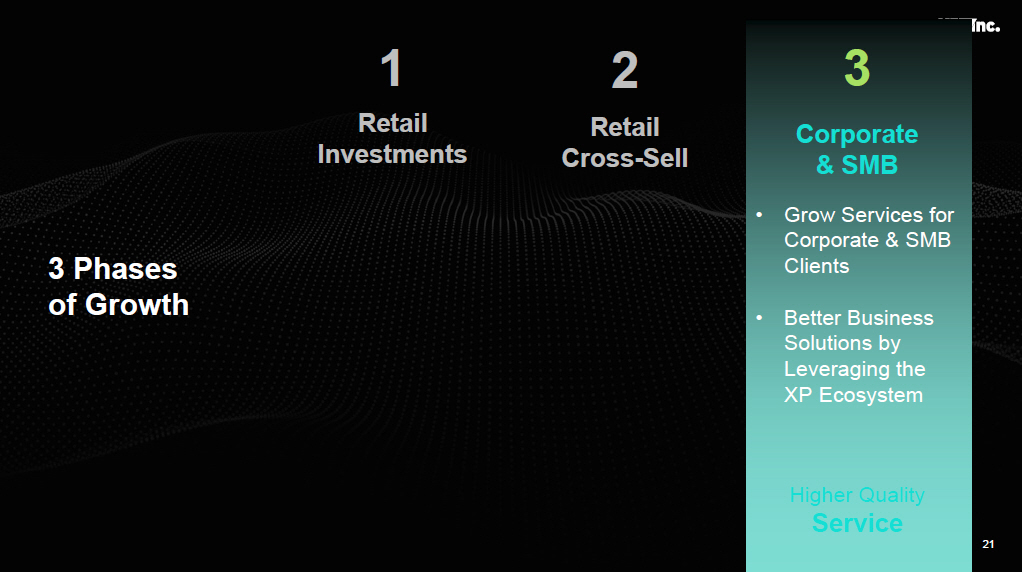
21 • Grow Services for Corporate & SMB Clients • Better Business Solutions by Leveraging the XP Ecosystem Retail Investments 1 Retail Cross - Sell 2 Corporate & SMB 3 Higher Quality Service 3 Phases of Growth
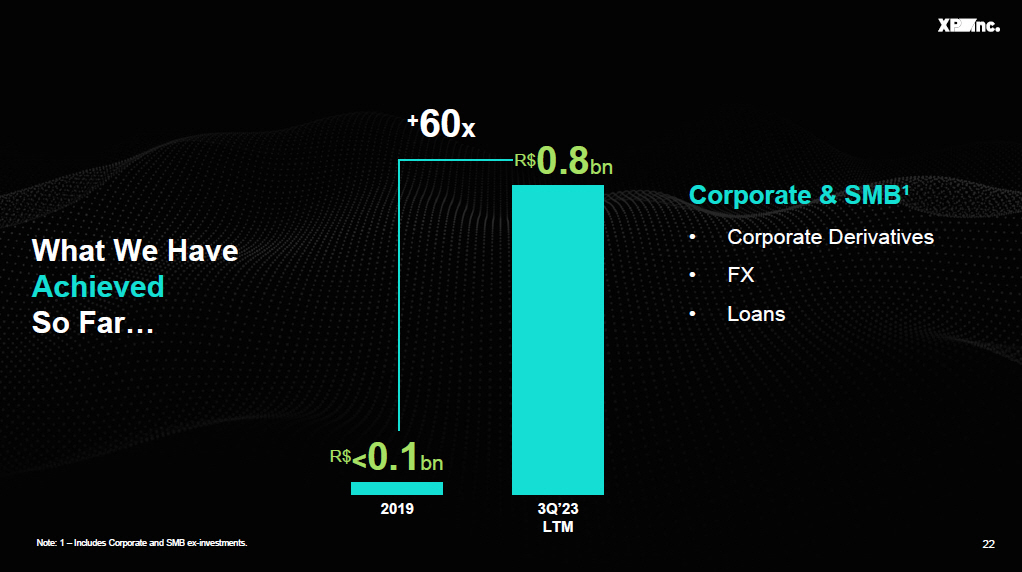
22 What We Have Achieved So Far… R$ < 0.1 bn 2019 3Q’23 LTM + 60 x R$ 0.8 bn Corporate & SMB¹ • Corporate Derivatives • FX • Loans Note: 1 – Includes Corporate and SMB ex - investments.

23 Corporate & SMB Is A Massive Untapped Opportunity We Estimate This Segment is ~10 Years Behind the Innovations & Services We Brought to Retail Investments Addressable Market Advantaged Pricing Business Relationships Growing Product Suite Large. Poorly Served. Ripe for Disruption. XP Developed the Fixed Income Market in Brazil Already Have +50,000 Corporate & SMB Relationships Curated for Businesses Increasing Our Ability to Grow Wallet Share In Global Markets Leveraging XPs Unique Position in the Market
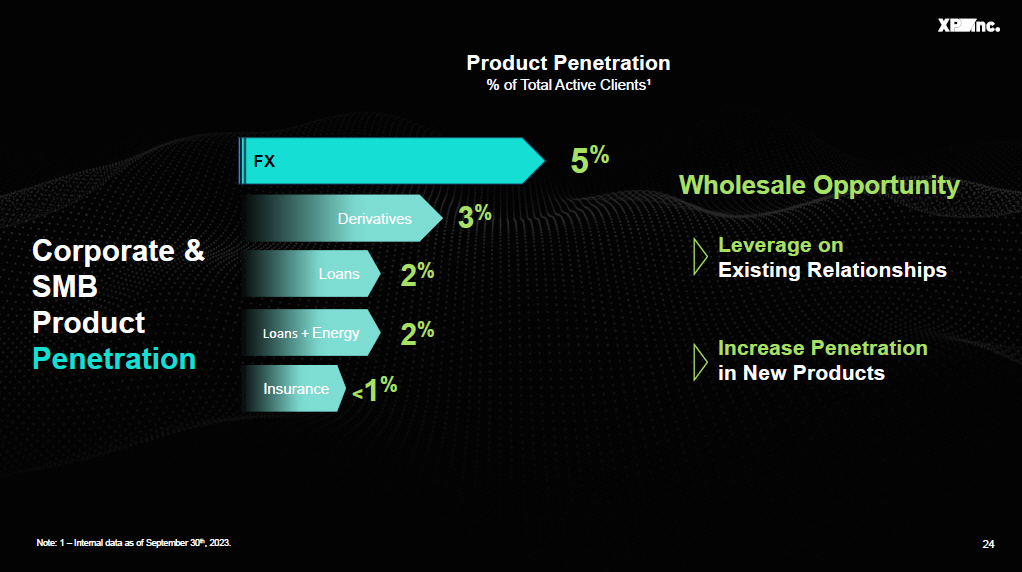
24 Corporate & SMB Product Penetration Product Penetration % of Total Active Clients¹ FX 5 % Derivatives 3 % Loans 2 % < 1 % Insurance Wholesale Opportunity Leverage on Existing Relationships Increase Penetration in New Products Note: 1 – Internal data as of September 30 th , 2023. Loans + Energy 2 %

25 Our Goal for Corporate & SMB¹: + R$ 1 - 2 Billion in Incremental Revenue 2019 3Q’23 LTM 2026 x More Products x More Penetration x More Reinforcement R$ 1.8 - 2.8 Bn R$ < 0.1 bn R$ 0.8 bn Note: 1 – Includes Corporate and SMB ex - investments.

26 XP Evolution Since the IPO Democratizing Investing Empowering Investors Higher Quality Client Experience IPO • Retail • Banking • Asset Management Retail Today Mission Business Lines Key Focus Cross - Sell New Verticals Growth Drivers Win More Clients Expand Salesforce Increase Engagement More Diversification More Assets More Distribution New Value Proposition Open Platform for Investments Better Quality • Retail Advisory Services • Corporate & SMB Solutions More Points of Acquisition More Financial Solutions

Retail Deep Dive INVESTOR DAY XP INC. 2023 Guilherme Sant’Anna Retail & Distribution Executive Director

Retail Opportunity INVESTOR DAY XP INC. 2023 03. Retail Deep Dive

Real Opportunity to Capture Additional Market Share Retail Asset TAM by 2028 1 R$ 11 trillion Sizable Market Opportunity Underserved Retail Investors Clear Path to Expand Our Advisor Network 21 % Source and notes: 1 – Internal forecast, calculated based on data from Anbima and Susep; 2 – Estimated number of individuals wit h assets available for investing, based on regional GDP and Anbima data; 3 – Considers Anbima data for affluent and mass affluent segments; 4 – Reasons for not investing are based on our internal surveys; 5 – Based on internal data. Potential New XP Clients 2 25 million Client Assets in Low Yielding Deposits 3 (Savings Account) 40 % Clients Have Not Invested Because they 4 48k 29k Investment Professionals in Brazil 5 Work for the Incumbent Big Banks Capture Share from Incumbents Differentiate Through Education & Relationships Expand Our Large Advisor Network “Lack Knowledge” “Need Help from an Advisor” 29

INVESTOR DAY XP INC. 2023 Platform Value Proposition 03. Retail Deep Dive

31 Providing a Differentiated Value Proposition Better Products Better Access Better Learning Journey Better Experience Low - Cost, Digital Financial Products to Help Clients Open Platform to Access the Best 3 rd Party & Proprietary Financial Products Help Investors to Manage Their Finances Effectively High Quality Advisors Who Provide Thoughtful Advice & Support Invest Money Save Money Spend Money Borrow Money Protect Assets + 160 Independent Asset Managers + 1,000 Investment Products 72 Net Promoter Score

Our Products Platform Enables Advisors to Provide Superior Client Experience Broadest Investment Products + 500 + 200 Growing Range Financial Products XP Funds 32 3 rd Party Funds Equities & FI + 160 Independent Asset Managers + 1,000 Investment Products PE Funds New Issuances & More Retirement Loans Cards Global Investments Insurance Deposits Foreign Exchange Market Innovation
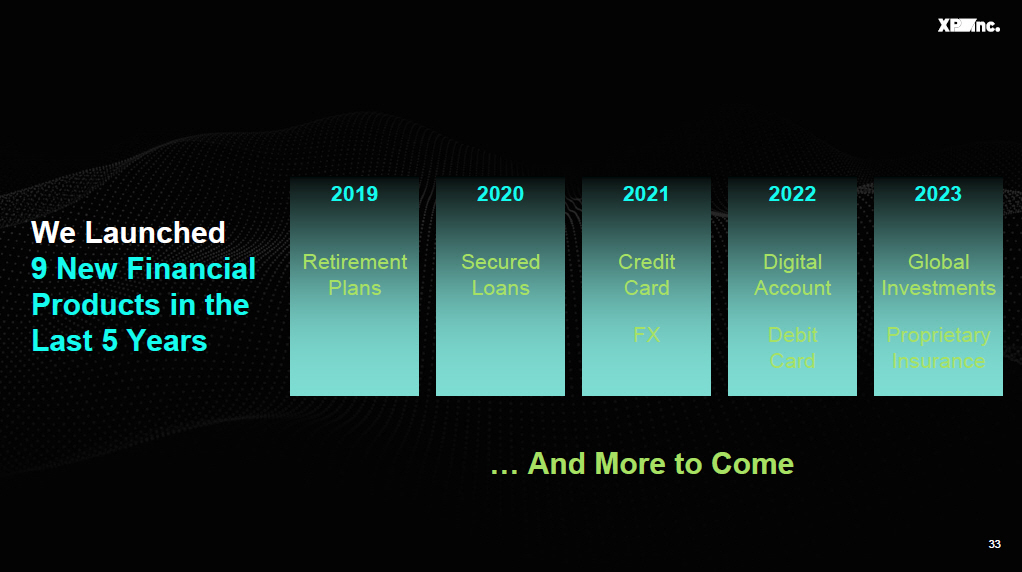
33 We Launched 9 New Financial Products in the Last 5 Years 2019 2020 2022 2023 2021 Retirement Plans Secured Loans Credit Card Digital Account Global Investments FX Debit Card Proprietary Insurance … And More to Come

34 Invest Money 1 I nvestment P roducts & Retirement Plans Save Money Digital Bank Account Spend Money Credit & Debit cards Borrow Money Loans Protect Assets I nsurance Pr oducts 2 3 4 5 Our Retail Products Are Designed to Serve Clients Across their Financial Journey 34

Advisor Value Proposition INVESTOR DAY XP INC. 2023 03. Retail Deep Dive

INVESTOR DAY XP INC. 2023 36

17 top 20 IFAs Are with XP IFA Offices Ranked by # of Advisors 37 1 Invest Smart 2 EQI 3 Monte Bravo 4 Blue3 5 Avel 6 Svn 7 Valor 8 Messem 9 Manchester 10 Alta Vista 11 Wise 12 Acqua 13 Saron 14 Braúna 15 Criteria 16 Liberta 17 Manhattan 18 Faz Capital 19 Riva 20 Veedha Rapidly Growing XP IFAs (in thousands) 14.3 12.4 10.3 8.2 5.9 3Q19 2020 2021 2022 3Q23 Creating the Largest & Most Successful IFA Network in Brazil XP Advisors Former XP Advisors Source and notes: number of IFAs are published on Ancord databases.

38 Notes: 1 – New B2B Channels (RIAs and Wealth Managers) and B2C; 2 – From January 2021 to September 2023. 1Q21 3Q21 1Q22 3Q22 1Q23 3Q23 +129 % Client Asset CAGR (Jan’21 – Sep’23) +81 % Active Advisors (33 - month CAGR²) +40 % Client Assets (33 - month CAGR²) +34 % Active Clients (33 - month CAGR²) We Have Replicated Our IFA Success in New Channels New B2B Channels RIA # of Active RIAs Wealth Manager Asset Growth B2C Channel +720 bps % Client Assets from New Channels 1 since IPO 24 698

39 White - Label App for Advisors to Tailor the Client Experience Partner Layout (app, portal, e - mail) Features 100% flexible (drag n drop) XP security level embedded Roadmap XP 100% incorporated No additional resources requested for the partner ( eng. , design, product) Synchronized Updates across all XP Apps White Label Platform Attract & Retain High Volume IFAs
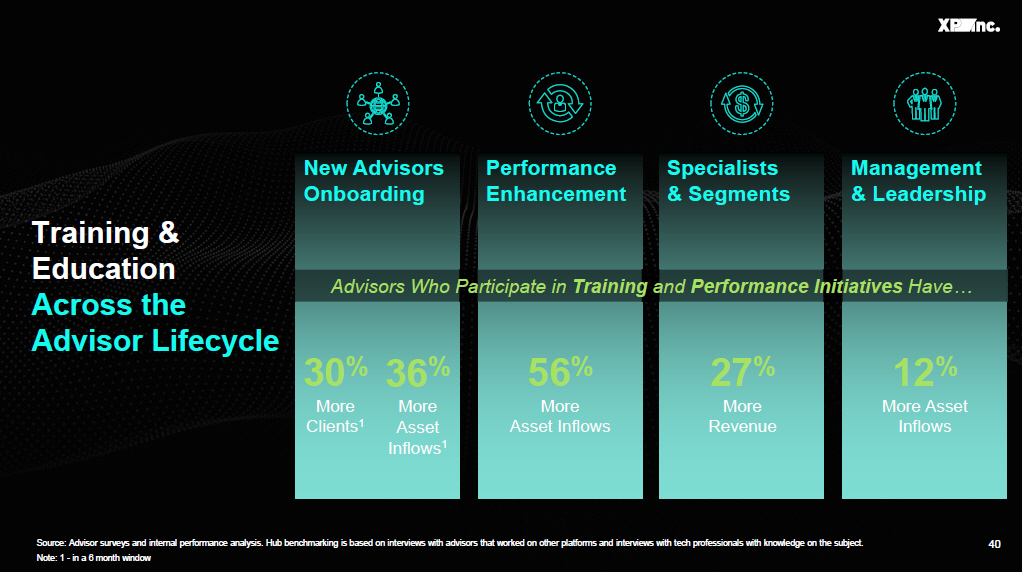
40 Source: Advisor surveys and internal performance analysis. Hub benchmarking is based on interviews with advisors that worked on other platforms and interviews with tech professionals with knowledge on the subject. Note: 1 - in a 6 month window Training & Education Across the Advisor Lifecycle New Advisors Onboarding Performance Enhancement Specialists & Segments Management & Leadership 30 % More Clients 1 36 % More Asset Inflows 1 56 % More Asset Inflows 27 % More Revenue 12 % More Asset Inflows Advisors Who Participate in Training and Performance Initiatives Have…

41 Proprietary Tech & Data Tools Empower Advisors Throughout the Day Daily Preparation & Review Relationship Management & Execution Closing XP HUB Data & Intelligence Proprietary Tools ▪ Performance reports ▪ Client satisfaction tracking ▪ Educational content ▪ A.I. portfolio recommendations ▪ Client task management ▪ Prospect dashboard ▪ Client portfolio reports ▪ Portfolio simulation & performance forecasting ▪ Cash flow tracking ▪ Fee management Maximize Client Facing Time Reduce Friction & Support Issues 70 % Current 90 % Future Target 8 % 2022 4 % 2023 Time Spent Client Facing Support Contact Rate

42 40% Digital Feature Completeness¹ Most Complete Digital Empowerment Applications Complete Digital Offering U.S. Player 1 U.S. Player 2 Brazil Player 1 Brazil Player 3 Brazil Player 2 80 % 60 % 60 % 50 % 40 % 40 % Predictive Models Expert Allocation & Digital First ▪ Efficient recommendations on portfolio diversification, performance & client profile ▪ Client browser data for better assertiveness on recommendations 45 % More Revenue 80 % More Net Inflows Better Performance for Advisors who Use Expert Allocation Source: Based on Company analysis.
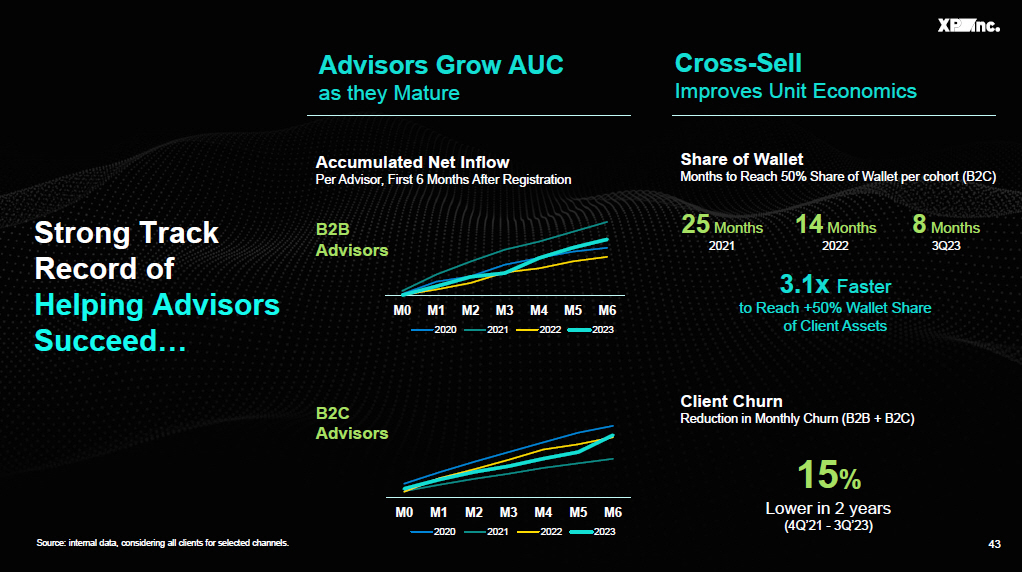
43 Source: internal data, considering all clients for selected channels. M0 M1 M2 M3 M4 M5 M6 2020 2021 2022 2023 M0 M1 M2 M3 M4 M5 M6 2020 2021 2022 2023 Accumulated Net Inflow Per Advisor, First 6 Months After Registration Strong Track Record of Helping Advisors Succeed… Advisors Grow AUC as they Mature Cross - Sell Improves Unit Economics B2B Advisors B2C Advisors 8 Months 3Q23 Share of Wallet Months to Reach 50% Share of Wallet per cohort (B2C) 14 Months 2022 25 Months 2021 3.1x Faster to Reach +50% Wallet Share of Client Assets Client Churn Reduction in Monthly Churn (B2B + B2C) 15 % Lower in 2 years (4Q’21 - 3Q’23)

Advisor Service Excellence Key Strategic Driver 44 Source and notes: 1 – NPS attributes are mapped on our internal NPS survey; 2 – the 7 portfolio strategies that we track are equ ities, fixed income inflation indexed, fixed income interest rate indexed, fixed income prefixed, hedge funds, alternative funds and globa l i nvestments; 3 – Comparison between clients with 3 versus 7 portfolio strategies. Trust and professionalism 48 % 80% of Advisor’s NPS¹ comes from quality attributes Closing the market service gap Quality of the recommendations 19 % Attention and cordiality 13 % Advised clients have on average 4 from the 7 possible portfolio strategies² # 4/7 Client Portfolio return + 56 % Client ARPAC + 58 % More diversified clients³ have: Portfolio diversification directly linked with client’s KPIs With superior portfolio allocation New Initiatives: Financial planning experience embedded on Hub with new tools for understanding client’s needs Allocation adherence score available for advisors during portfolio simulation Automated rebalancing for managed portfolios

INVESTOR DAY XP INC. 2023 Growth Strategy

46 Regionalization Strategy Large Opportunity Across Brazil Local Investment Lounge for retail clients to meet with their advisors ▪ Builds awareness & trust ▪ Targets specific, high value regions Investment Lounge Launch Plan ▪ 1st Concept Opened in Manaus ▪ 5 XP Lounges in 2024 ▪ 5 XP Lounges in 2025 ▪ + 1,000 Advisors Regionalized Service Model Growth Strategy Client & Advisor Proximity Driving Growth Grow Regionally with Limited CapEx Southeast South Northeast Middle West North Relative Regional Market Share

Our Powerful Ecosystem INVESTOR DAY XP INC. 2023 José Berenguer CEO XP Bank

INVESTOR DAY XP INC. 2023 48 Introduction 03. Our Powerful Ecosystem

Retail I nvestments We Disrupted the Market By Creating a Powerful Ecosystem Around Retail Investors Changing the way people invest in Brazil 49 49
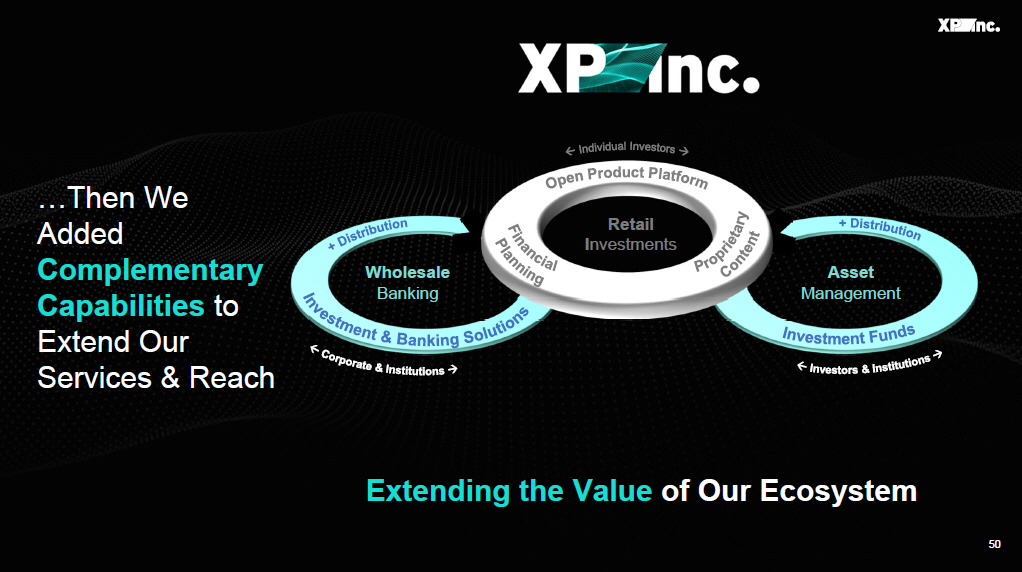
Retail I nvestments Asset Management Wholesale Banking …Then We Added Complementary Capabilities to Extend Our Services & Reach Extending the Value of Our Ecosystem 50 50
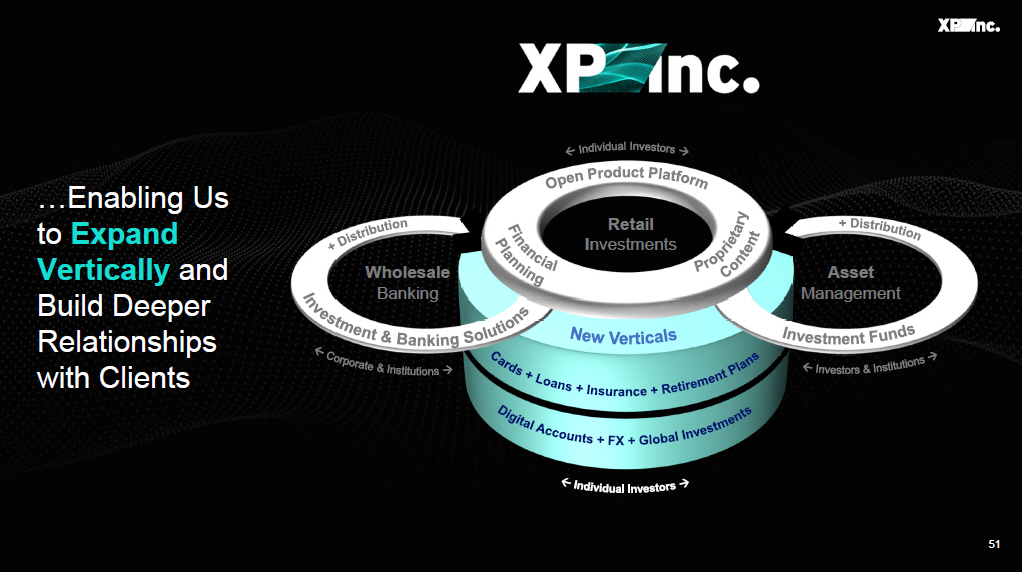
Retail I nvestments Asset Management Wholesale Banking …Enabling Us to Expand Vertically and Build Deeper Relationships with Clients 51 51

Retail I nvestments Asset Management Wholesale Banking The Enhanced XP Ecosystem Provides Significant Competitive Advantages 52 52
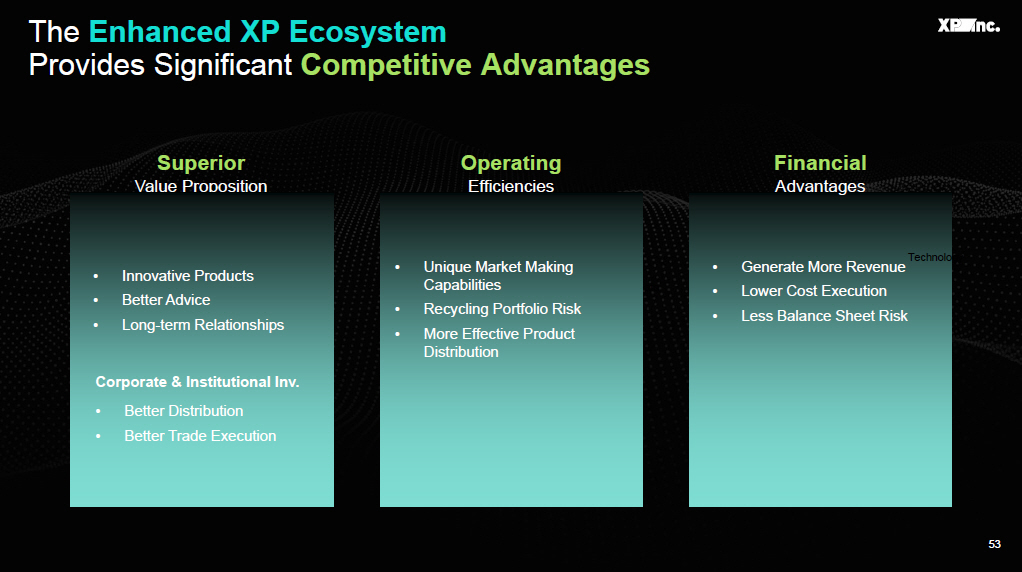
& Data Retail Superior Value Proposition • Innovative Products • Better Advice • Long - term Relationships Corporate & Institutional Inv. • Better Distribution • Better Trade Execution Operating Efficiencies • Unique Market Making Capabilities • Recycling Portfolio Risk • More Effective Product Distribution Financial Advantages • Generate More Revenue • Lower Cost Execution • Less Balance Sheet Risk Technology The Enhanced XP Ecosystem Provides Significant Competitive Advantages 53

INVESTOR DAY XP INC. 2023 54 Wholesale Banking 03. Our Powerful Ecosystem

Wholesale Banking Solutions Investment Banking Global Markets Broker Dealer Banking Products 55
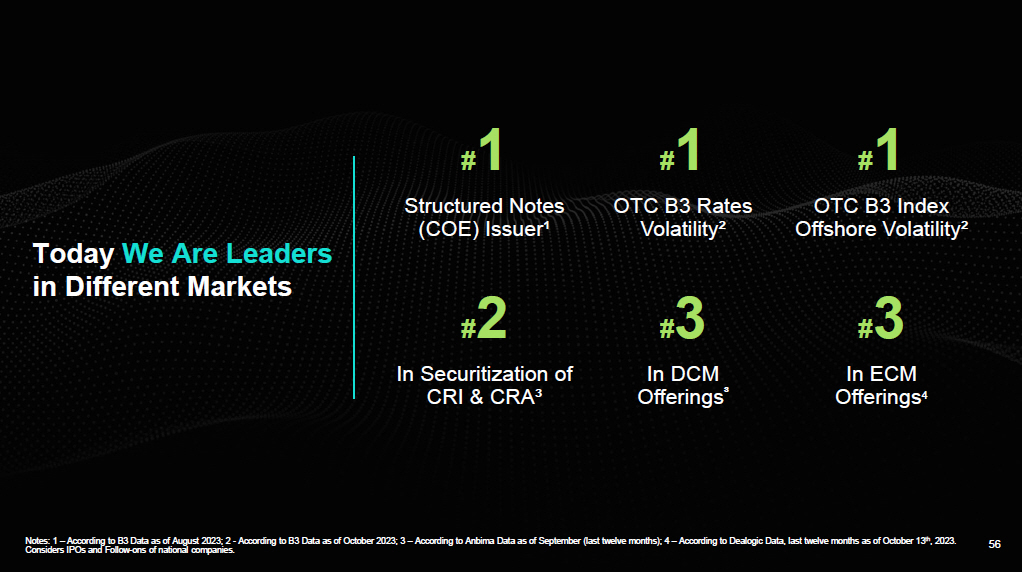
Today We Are Leaders in Different Markets # 1 Structured Notes (COE) Issuer¹ # 3 In DCM Offerings ³ # 2 In Securitization of CRI & CRA³ # 1 OTC B3 Rates Volatility² # 1 OTC B3 Index Offshore Volatility² Notes: 1 – According to B3 Data as of August 2023; 2 - According to B3 Data as of October 2023; 3 – According to Anbima Data as of September (last twelve months); 4 – According to Dealogic Data, last twelve months as of October 13 th , 2023. Considers IPOs and Follow - ons of national companies. # 3 In ECM Offerings 4 56

Its Just a Matter of Time… to Replicate the Success We Had with Retail in Wholesale Banking Leveraged by unique combination of Retail and Wholesale distribution Sophisticated Retail Investors Creative Product Structuring and Tailored Solutions Well - Established Wholesale Franchise Broader Access to Capital Lower Risk Powered by Client Flow Leveraging on Market Making Capabilities “Go - to” Provider for Corporates & SMBs Lower Capital Consumption 57 XP Retail Provides a Unique Competitive Advantage to Wholesale Banking

Global Markets XP is the leader in the markets in which we operate, providing solutions through derivatives, FX, and structured solutions. Unparallel Profitability and Low Risk Combination Powered by Retail and Institutional Deal Flow Institutional Deal Flow Retail Deal Flow Recycling Risk Our Market Making Capabilities Position XP Ahead of Peers Local and International Investors 58

Notes: 1 - Data is shown on a weekly basis; 2 – Average from the last twelve months – Data as of September 30th, 2023 Our Market Risk Comes from a Market Making Business Market Making Book Performance¹ R$ 27 Mn Average² Daily VaR , 95% 0 Negative Months in 3 Years 50 100 150 200 250 300 350 Jan - 21 Apr - 21 Jul - 21 Oct - 21 Jan - 22 Apr - 22 Jul - 22 Oct - 22 Jan - 23 Apr - 23 Jul - 23 Oct - 23 XP Market Making IBOV S&P 329% 112% 93% 100% 59

Roadmap for 2026 – Corporate & SMB¹ 60 Gross Revenue (in R$ Bn) 2019 3Q’23 LTM 2026 R$ 1.8 - 2.8 Bn R$ < 0.1 bn R$ 0.8 bn Note: 1 – Includes Corporate and SMB ex - investments. Gross Revenue by Product 60% 3Q’23 LTM 2026 20% 25 - 35% 20% 25 - 35% 25 - 35% Current Products Grow client base, mainly in Derivatives Credit Other new verticals Expand Credit portfolio (e.g. trade finance) Scale new products - Digital account - FX - Insurance 100% 100%

Financial Deep Dive INVESTOR DAY XP INC. 2023 Bruno Constantino CFO
INVESTOR DAY XP INC. 2023 62 Financial Overview 04. Financial Deep Dive

63 3Q’19 @IPO 3Q’23 LTM Current 3.2 x Gross Revenue 18.6 % 26.0 % + 735 bps Net Income Net Margin XP Has Delivered Solid Value Creation Since the IPO... R$ 4.7 Billion R$ 14.8 Billion 4.5 x R$ 3.6 Billion R$ 0.8 Billion

2019 3Q23 LTM New Verticals + Corporate & SMB Retirement Plans Cards Digital Account Loans Insurance Global Investments FX Corporate & SMB¹ 64 64 Note: 1 – Includes Corporate and SMB ex - investments. 2.6 % 17.8 % 14 x New Verticals and Corporate & SMB as a % of Total Gross Revenue ...Improving Our Model Into A More Diversified Revenue Stream...

...While Maintaining Strict Cost Discipline 3Q19 3Q20 3Q21 3Q22 3Q23 Efficiency Ratio¹ (%) Compensation Ratio³ (%) Efficiency Ratio Ex - SBC² 37.3% 33.5% 37.6% 38.9% 37.3% 38.4% 33.0% 41.7% 36.5% 3Q19 3Q20 3Q21 3Q22 3Q23 Compensation Ratio Ex - SBC² 25.7% 22.0% 24.8% 25.3% 23.7% 27.9% 22.6% 29.8% 24.6% 65 Notes: 1 – Efficiency ratio is calculated as SG&A ex - revenue from incentives from Tesouro Direto , B3, and others divided by Net Revenue; 2 – Excludes Share Based Compensation; 3 - Compensation ratio is calculated as People SG&A (Salary and Taxes, Bonuses and Share Based Compensation) divided by Net Revenue.
INVESTOR DAY XP INC. 2023 66 Retail Unit Economics 04. Financial Deep Dive

XP Retail Investment Leadership MORE Active Clients MORE Advisors MORE Assets 4.4 million Active Clients 187 % Growth since IPO 14.3 k Advisors 70 % IFAs Market Share¹ R$ 1.1 trillion Client Assets 11 % Market Share² 67 Notes: 1 – Considers Ancord (Brazilian Association of Securities Dealers) Data; 2 – Investments for Individuals Market Share, according to Anbima data.

Digital Account 2022 Full Financial Platform x Capture Greater Wallet Share x Diversify Our Revenue Streams x Improve Lifetime Value We Launched Several New Products in the Last 4 Years Rapid Scalability Of Our Ecosystem + 868 thousand Active Credit Cards + 77 thousand Primary Active Accounts¹ R$ 27 billion Loan Operations² + 50 thousand Active Policies Credit Card 2021 Debit Card 2022 Retirement Plans 2019 Secured Loans 2020 Global Investments 2023 Proprietary Insurance 2023 FX 2021 68 Notes: 1 – Primary Active Digital Accounts as of September 30 th , 2023; 2 – Gross Loan Operations as of September 30 th , 2023.

Average Products per Client Across All Cohorts¹ 0 5 10 15 20 25 30 1.00 1.25 1.50 1.75 2.00 0 5 10 15 20 25 30 1.00 1.25 1.50 1.75 2.00 Advised Clients (B2B + B2C) Self - Directed (Rico + B2C Online) Q1 2021 Q3 2023 Registration date Months After Registration XP Advisory Improves Cross - Sell + 70 % Growth since 3Q19 1.7 out of 8 Cross - Sell Index 3Q23 69 Note: 1 – Products considered: Investments 1, and 7 other cross - sell products: Credit Card, Digital Account, Loans, Retirement P lans, Insurance, FX, Global Investments. Maximum of this indicator is 8. Months After Registration

Cross - Sell Product Penetration 15 54 2 42 Active Clients with Multiple Products % of Total Active Clients (Only B2B and B2C) 1Q21 2Q22 1 Q23 2Q23 70 Note: Data includes only XP brand (B2B and B2C). Advised Clients Self - Directed Clients % % % % 3 Q21 2Q21 3 Q22 4Q22 1 Q22 4 Q21
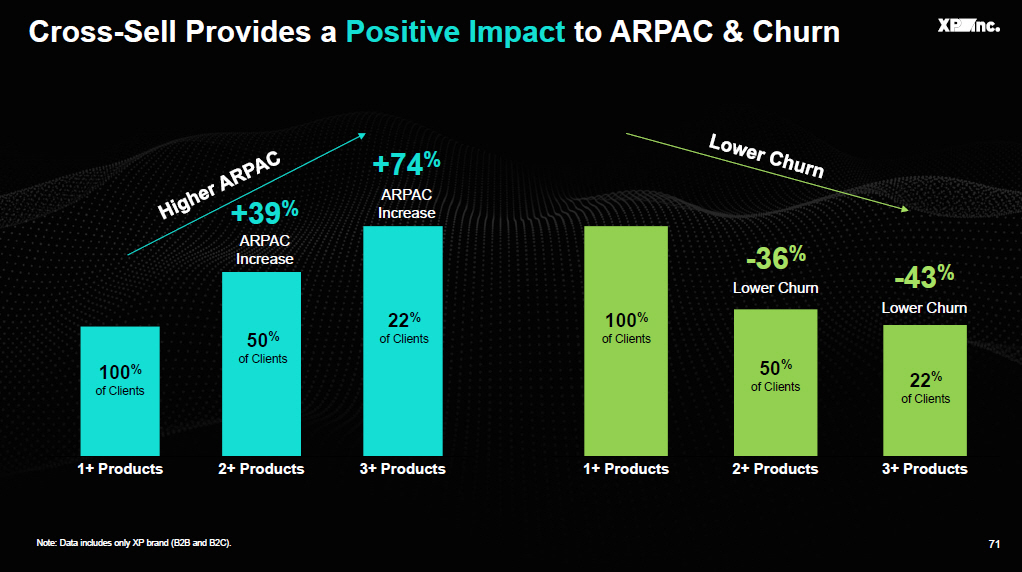
Cross - Sell Provides a Positive Impact to ARPAC & Churn +74 % ARPAC Increase +39 % ARPAC Increase 1+ Products 2+ Products 3+ Products 100 % of Clients 50 % of Clients 22 % of Clients 1+ Products 2+ Products 3+ Products 100 % of Clients 50 % of Clients 22 % of Clients - 43 % Lower Churn - 36 % Lower Churn 71 Note: Data includes only XP brand (B2B and B2C).

More Cross - Sell Better Retention Higher Share of Wallet More ARPAC Higher Lifetime Value …Improving Client Lifetime Value 5 x Higher Lifetime Value Cross - Sold Clients Have 72

INVESTOR DAY XP INC. 2023 73 Balance Sheet 04. Financial Deep Dive

2021 2022 3Q23 26.9% 25.5% 22.1% We Operate with a Comfortable Balance Sheet ... Managerial BIS 1 (%) x Comfortable Capital Position Sustaining business dynamics x Growth Opportunities Poised to disrupt new businesses while returning capital to shareholders 1 – Company data based on Central Bank methodology. + R$ 6.3 billion in Dividends and Buybacks in two years 74 74 Expected Range 16% - 19%

...Maintaining an Asset - light Approach XP Inc. Total RWA¹ (R$ billion) Total RWA / Total Assets vs. Peers ² 34% 31% 34% 0 10 20 30 40 50 60 70 80 0 80 2021 2022 3Q23 46.7 59.5 78.2 Total RWA RWA / Total Assets 45% 88% 83% 89% 86% 68% 19% 4% 2% 5% 23% 36% 8% 14% 9% 9% 9% 3% 100 100 100 100 100 100 34% 50% 50% 59% 54% 71% RWA for Operational Risk RWA for Market Risk RWA for Credit Risk Note: 1 – Company Data based on Central Bank Methodology; 2 – As of September 30, 2023. 75 75

R$ billion Secured Unsecured Total Loans 18.9 1.1 20.1 Credit Card 4.6 2.2 6.8 Corporate Securities 2.9 10.0 12.9 Credit Portfolio 26.4 13.3 39.8 76 • Credit Portfolio Note: 1 – Gross of Expected Credit Losses. Data as of September 30 th , 2023. New Disclosure: Total Credit Portfolio 1 Main Activities 76 • Investment Banking • Fixed Income Distribution • Corporate Credit

0 50 100 150 200 250 300 Liquidity Above Industry Average... 77 3Q22 4Q22 1Q23 2Q23 3Q23 38.0 39.1 40.4 55.1 49.2 212 % 217 % Eligible High Quality Liquid Assets¹ (R$ Bn) Liquidity Coverage Ratio¹ 77 Note: 1 – Company Data based on Central Bank Methodology.

INVESTOR DAY XP INC. 2023 78 Roadmap For 2026 04. Financial Deep Dive

R$ 14.8 Bn 3Q23 LTM 2026E Roadmap for 2026 Additional Gross Revenue Levers + New Verticals Cross - Sell¹ + Market Share + Turnover + Mix + Corporate & SMB² 79 79 R$ 5 - 7 Bn R$ 2 - 3 Bn R$ 1 - 2 Bn R$ 22.8 - 26.8 Bn Note: 1 – Includes only Individuals; 2 – Includes Corporate and SMB ex - investments. 26 % 30 - 34 % EBT Margin

Final Remarks & Q&A INVESTOR DAY XP INC. 2023 Thiago Maffra CEO

INVESTOR DAY XP INC. 2023 81 Final Remarks 05. Final Remarks & Q&A

82 XP Is Better Positioned Today vs 2019 x Bigger. Stronger. Better. Market Position Business Model Growth Engine Operating Efficiency Long - Term Value 1 2 3 4 5 x More Diversified & Resilient x Battle Proven in a Difficult Market x More Efficient with Better Ratios x Greater Ability to Create Value …To Pursue a Much Larger Addressable Market Opportunity 82

INVESTOR DAY XP INC. 2023 83 Q&A 05. Final Remarks & Q&A

84
XP (NASDAQ:XP)
Historical Stock Chart
From Jun 2024 to Jul 2024

XP (NASDAQ:XP)
Historical Stock Chart
From Jul 2023 to Jul 2024
