
We could not find any results for:
Make sure your spelling is correct or try broadening your search.

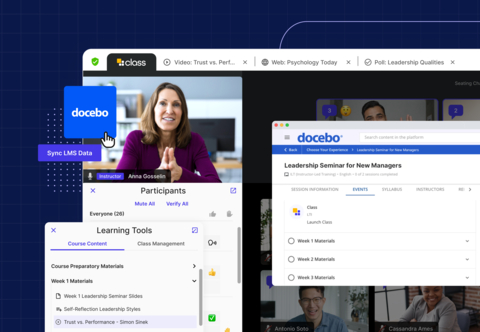
Docebo Inc offers cloud-based learning platform for both internal and external enterprise learning with real time tracking of training results, optimizing time, and reducing costs associated with traditional learning methods. Geographically, it holds presence in five offices around the world, includ... Docebo Inc offers cloud-based learning platform for both internal and external enterprise learning with real time tracking of training results, optimizing time, and reducing costs associated with traditional learning methods. Geographically, it holds presence in five offices around the world, including locations in Europe, Asia and North America. The firm derives its revenues from two main sources: software as-a-service application (SaaS); and professional services revenue, which includes services such as initial project management, training, and integration. Show more


| Period | Change | Change % | Open | High | Low | Avg. Daily Vol | VWAP | |
|---|---|---|---|---|---|---|---|---|
| 1 | -8.96 | -21.8270401949 | 41.05 | 41.05 | 32.005 | 105256 | 38.26745065 | CS |
| 4 | -10.85 | -25.2678155566 | 42.94 | 43.4 | 32.005 | 61497 | 40.24635236 | CS |
| 12 | -17.76 | -35.6268806419 | 49.85 | 50.8 | 32.005 | 61663 | 43.51898146 | CS |
| 26 | -13.59 | -29.7504378284 | 45.68 | 53.86 | 32.005 | 60361 | 45.17918357 | CS |
| 52 | -21.91 | -40.5740740741 | 54 | 56.41 | 32.005 | 83034 | 43.08290355 | CS |
| 156 | -18.88 | -37.0413969001 | 50.97 | 56.41 | 23.4 | 66205 | 40.41072611 | CS |
| 260 | -18.92 | -37.0907665164 | 51.01 | 92.75 | 23.4 | 70675 | 47.1895855 | CS |
 Waynewayne
3 minutes ago
fuagf
7 minutes ago
Waynewayne
3 minutes ago
fuagf
7 minutes ago
 RealDutch
11 minutes ago
RealDutch
11 minutes ago
 TRAPPER JIM
14 minutes ago
sab63090
14 minutes ago
TRAPPER JIM
14 minutes ago
sab63090
14 minutes ago
 Jack Torrance
20 minutes ago
mugs57
24 minutes ago
Investor Will
25 minutes ago
sab63090
28 minutes ago
Jack Torrance
20 minutes ago
mugs57
24 minutes ago
Investor Will
25 minutes ago
sab63090
28 minutes ago
 LVerstee
29 minutes ago
Omar8
31 minutes ago
sab63090
33 minutes ago
LVerstee
29 minutes ago
Omar8
31 minutes ago
sab63090
33 minutes ago
 capgain
35 minutes ago
sab63090
40 minutes ago
carvajal
41 minutes ago
phrocks
46 minutes ago
Peter J
48 minutes ago
carvajal
52 minutes ago
WooptdooU
57 minutes ago
edbi46
58 minutes ago
carvajal
60 minutes ago
WooptdooU
1 hour ago
capgain
35 minutes ago
sab63090
40 minutes ago
carvajal
41 minutes ago
phrocks
46 minutes ago
Peter J
48 minutes ago
carvajal
52 minutes ago
WooptdooU
57 minutes ago
edbi46
58 minutes ago
carvajal
60 minutes ago
WooptdooU
1 hour ago
 nowwhat2
1 hour ago
nowwhat2
1 hour ago

It looks like you are not logged in. Click the button below to log in and keep track of your recent history.
Support: +44 (0) 203 8794 460 | support@advfn.com
By accessing the services available at ADVFN you are agreeing to be bound by ADVFN's Terms & Conditions

 Hot Features
