We could not find any results for:
Make sure your spelling is correct or try broadening your search.

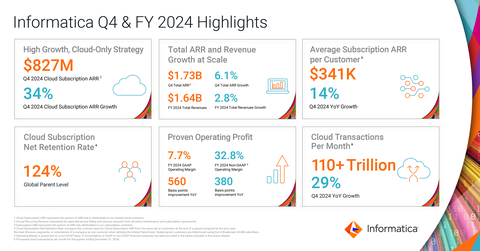
Informatica Inc is a pioneered a new category of software, the Intelligent Data Management Cloud, or IDMC. IDMC is a AI-powered platform that connects, manages, and unifies data across any multi-cloud, hybrid system, empowering enterprises to modernize and advance data strategies. Informatica Inc is a pioneered a new category of software, the Intelligent Data Management Cloud, or IDMC. IDMC is a AI-powered platform that connects, manages, and unifies data across any multi-cloud, hybrid system, empowering enterprises to modernize and advance data strategies.

| Period | Change | Change % | Open | High | Low | Avg. Daily Vol | VWAP | |
|---|---|---|---|---|---|---|---|---|
| 1 | -0.72 | -3.74025974026 | 19.25 | 19.49 | 18.27 | 2134873 | 18.77529666 | CS |
| 4 | -7.32 | -28.3172147002 | 25.85 | 26.38 | 16.37 | 4240364 | 20.3795147 | CS |
| 12 | -8.7 | -31.9500550863 | 27.23 | 27.6 | 16.37 | 2374134 | 22.44218078 | CS |
| 26 | -5.94 | -24.2746219861 | 24.47 | 28.14 | 16.37 | 2094304 | 24.13670451 | CS |
| 52 | -13.47 | -42.09375 | 32 | 39.8 | 16.37 | 1989943 | 27.07509976 | CS |
| 156 | 0.85 | 4.80769230769 | 17.68 | 39.8 | 13.29 | 1025353 | 25.32747391 | CS |
| 260 | -9.02 | -32.7404718693 | 27.55 | 40.13 | 13.29 | 1005737 | 25.65195509 | CS |
 splintered sunlight
16 seconds ago
Brysh
2 minutes ago
rosemountbomber
2 minutes ago
splintered sunlight
16 seconds ago
Brysh
2 minutes ago
rosemountbomber
2 minutes ago
 DiscoverGold
2 minutes ago
DiscoverGold
3 minutes ago
DiscoverGold
2 minutes ago
DiscoverGold
3 minutes ago
 AlwaysOptimistic
3 minutes ago
weedtrader420
3 minutes ago
ksquared
4 minutes ago
blackhawks
4 minutes ago
The_Gman
4 minutes ago
DrSleep
4 minutes ago
AlwaysOptimistic
3 minutes ago
weedtrader420
3 minutes ago
ksquared
4 minutes ago
blackhawks
4 minutes ago
The_Gman
4 minutes ago
DrSleep
4 minutes ago
 MrPuff
6 minutes ago
MrPuff
6 minutes ago
 $7.00 or Nothing
7 minutes ago
$7.00 or Nothing
7 minutes ago
 chklingon
9 minutes ago
Gmenfan
10 minutes ago
weedtrader420
10 minutes ago
t1215s
13 minutes ago
chklingon
9 minutes ago
Gmenfan
10 minutes ago
weedtrader420
10 minutes ago
t1215s
13 minutes ago
 Trooperstocks
14 minutes ago
plexrec
16 minutes ago
Trooperstocks
14 minutes ago
plexrec
16 minutes ago
 TJG
16 minutes ago
TJG
16 minutes ago
 Huggy Bear
19 minutes ago
louieforpar
19 minutes ago
Huggy Bear
19 minutes ago
louieforpar
19 minutes ago

It looks like you are not logged in. Click the button below to log in and keep track of your recent history.
Support: +44 (0) 203 8794 460 | support@advfn.com
By accessing the services available at ADVFN you are agreeing to be bound by ADVFN's Terms & Conditions

 Hot Features