
We could not find any results for:
Make sure your spelling is correct or try broadening your search.

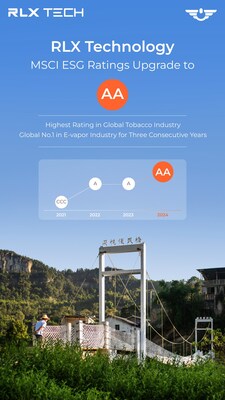
RLX Technology Inc is engaged in the manufacturing of e-vapor products for adult smokers. It has an integrated offline distribution and Branded store plus retail model tailored to China e-vapor market. RLX Technology Inc is engaged in the manufacturing of e-vapor products for adult smokers. It has an integrated offline distribution and Branded store plus retail model tailored to China e-vapor market.

| Period | Change | Change % | Open | High | Low | Avg. Daily Vol | VWAP | |
|---|---|---|---|---|---|---|---|---|
| 1 | -0.27 | -11.7903930131 | 2.29 | 2.38 | 1.91 | 15559731 | 2.07083308 | CS |
| 4 | -0.24 | -10.6194690265 | 2.26 | 2.69 | 1.91 | 8236291 | 2.22466049 | CS |
| 12 | 0.02 | 1 | 2 | 2.69 | 1.91 | 6105087 | 2.23463857 | CS |
| 26 | 0.36 | 21.686746988 | 1.66 | 2.69 | 1.57 | 6456554 | 1.98188397 | CS |
| 52 | 0.05 | 2.53807106599 | 1.97 | 2.69 | 1.5 | 4653471 | 1.94408581 | CS |
| 156 | -0.37 | -15.4811715481 | 2.39 | 3.06 | 0.9012 | 7562814 | 1.99039082 | CS |
| 260 | -20.32 | -90.9579230081 | 22.34 | 35 | 0.9012 | 8797484 | 4.09702497 | CS |
 TrendTrade2016
4 weeks ago
TrendTrade2016
4 weeks ago
TrendTrade2016
4 weeks ago
TrendTrade2016
4 weeks ago
 glenn1919
6 months ago
glenn1919
6 months ago
 OffTheGrid
2 years ago
OffTheGrid
2 years ago
 TommyBoyTrader9460
2 years ago
OffTheGrid
2 years ago
OffTheGrid
2 years ago
OffTheGrid
2 years ago
TommyBoyTrader9460
2 years ago
TommyBoyTrader9460
2 years ago
OffTheGrid
2 years ago
OffTheGrid
2 years ago
OffTheGrid
2 years ago
TommyBoyTrader9460
2 years ago
 $Money Bags$
3 years ago
$Money Bags$
3 years ago
 MDmojo
4 years ago
MDmojo
4 years ago
 ClayTrader
4 years ago
trades2win
4 years ago
ClayTrader
4 years ago
trades2win
4 years ago
 berdboy
4 years ago
berdboy
4 years ago
 bigbux1
4 years ago
sick nam vet
4 years ago
sick nam vet
4 years ago
sick nam vet
4 years ago
ClayTrader
4 years ago
zigland
4 years ago
sick nam vet
4 years ago
sick nam vet
4 years ago
sick nam vet
4 years ago
ClayTrader
4 years ago
bigbux1
4 years ago
sick nam vet
4 years ago
sick nam vet
4 years ago
sick nam vet
4 years ago
ClayTrader
4 years ago
zigland
4 years ago
sick nam vet
4 years ago
sick nam vet
4 years ago
sick nam vet
4 years ago
ClayTrader
4 years ago
 RJ Trotts
4 years ago
sick nam vet
4 years ago
sick nam vet
4 years ago
ClayTrader
4 years ago
sick nam vet
4 years ago
sick nam vet
4 years ago
IneedMORE
4 years ago
sick nam vet
4 years ago
ClayTrader
4 years ago
RJ Trotts
4 years ago
sick nam vet
4 years ago
sick nam vet
4 years ago
ClayTrader
4 years ago
sick nam vet
4 years ago
sick nam vet
4 years ago
IneedMORE
4 years ago
sick nam vet
4 years ago
ClayTrader
4 years ago
 Actualfactual
4 years ago
AlphaStockNews
4 years ago
Actualfactual
4 years ago
AlphaStockNews
4 years ago

It looks like you are not logged in. Click the button below to log in and keep track of your recent history.
Support: +44 (0) 203 8794 460 | support@advfn.com
By accessing the services available at ADVFN you are agreeing to be bound by ADVFN's Terms & Conditions

 Hot Features

