
We could not find any results for:
Make sure your spelling is correct or try broadening your search.

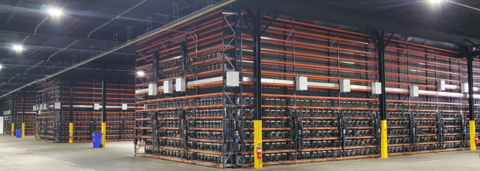
Ault Alliance Inc is a diversified holding company. It owns and operates a data center at which it mines Bitcoin and provides mission-critical products that support a diverse range of industries, including oil exploration, crane services, defense/aerospace, industrial, automotive, medical/biopharma,... Ault Alliance Inc is a diversified holding company. It owns and operates a data center at which it mines Bitcoin and provides mission-critical products that support a diverse range of industries, including oil exploration, crane services, defense/aerospace, industrial, automotive, medical/biopharma, consumer electronics, hotel operations and textiles. Show more


| Period | Change | Change % | Open | High | Low | Avg. Daily Vol | VWAP | |
|---|---|---|---|---|---|---|---|---|
| 1 | 0 | 0 | 0 | 0 | 0 | 0 | 0 | CS |
| 4 | 0 | 0 | 0 | 0 | 0 | 0 | 0 | CS |
| 12 | 0 | 0 | 0 | 0 | 0 | 0 | 0 | CS |
| 26 | 0 | 0 | 0 | 0 | 0 | 0 | 0 | CS |
| 52 | 0 | 0 | 0 | 0 | 0 | 0 | 0 | CS |
| 156 | 0 | 0 | 0 | 0 | 0 | 0 | 0 | CS |
| 260 | 0 | 0 | 0 | 0 | 0 | 0 | 0 | CS |
| Symbol | Price | Vol. |
|---|---|---|
| SOXLDirexion Daily Semiconductor Bull 3X Shares | US$ 17.99 (-13.84%) | 169.24M |
| MSTUT Rex 2X Long MSTR Daily Target ETF | US$ 4.04 (-33.55%) | 160.43M |
| SPXSDirexion Daily S&P 500 Bear 3X Shares New | US$ 7.22 (7.92%) | 105.01M |
| SPYSPDR S&P 500 | US$ 560.58 (-2.66%) | 96.77M |
| FXIiShares China Large Cap | US$ 35.935 (-2.77%) | 80.62M |
 mark2market
5 months ago
mark2market
5 months ago
 Lime Time
6 months ago
Roozy
6 months ago
Lime Time
6 months ago
Roozy
6 months ago
Roozy
6 months ago
Roozy
6 months ago
Roozy
7 months ago
Roozy
7 months ago
IU
7 months ago
Roozy
7 months ago
drhome
7 months ago
Roozy
7 months ago
Roozy
7 months ago
Roozy
7 months ago
Roozy
8 months ago
PennyStockTrader2
8 months ago
IU
8 months ago
Roozy
8 months ago
PennyStockTrader2
8 months ago
Roozy
8 months ago
Roozy
9 months ago
IU
9 months ago
Lime Time
6 months ago
Roozy
6 months ago
Lime Time
6 months ago
Roozy
6 months ago
Roozy
6 months ago
Roozy
6 months ago
Roozy
7 months ago
Roozy
7 months ago
IU
7 months ago
Roozy
7 months ago
drhome
7 months ago
Roozy
7 months ago
Roozy
7 months ago
Roozy
7 months ago
Roozy
8 months ago
PennyStockTrader2
8 months ago
IU
8 months ago
Roozy
8 months ago
PennyStockTrader2
8 months ago
Roozy
8 months ago
Roozy
9 months ago
IU
9 months ago
 DawgTrading
9 months ago
DawgTrading
9 months ago
 Esa
9 months ago
Esa
9 months ago
 Zardiw
9 months ago
DawgTrading
9 months ago
DawgTrading
9 months ago
Zardiw
9 months ago
DawgTrading
9 months ago
DawgTrading
9 months ago
 powerbattles
9 months ago
Zardiw
9 months ago
Zardiw
9 months ago
Roozy
9 months ago
Zardiw
9 months ago
Roozy
9 months ago
Zardiw
9 months ago
Zardiw
9 months ago
Zardiw
9 months ago
Roozy
9 months ago
powerbattles
9 months ago
Zardiw
9 months ago
Zardiw
9 months ago
Roozy
9 months ago
Zardiw
9 months ago
Roozy
9 months ago
Zardiw
9 months ago
Zardiw
9 months ago
Zardiw
9 months ago
Roozy
9 months ago
 Zap Rowsdower
10 months ago
Roozy
10 months ago
Roozy
10 months ago
DawgTrading
10 months ago
powerbattles
10 months ago
Zap Rowsdower
10 months ago
Roozy
10 months ago
Roozy
10 months ago
DawgTrading
10 months ago
powerbattles
10 months ago
 Golden Cross
10 months ago
vegasopc
10 months ago
Roozy
10 months ago
Golden Cross
10 months ago
vegasopc
10 months ago
Roozy
10 months ago
 Surfacetite
10 months ago
Roozy
10 months ago
Roozy
10 months ago
Roozy
10 months ago
Surfacetite
10 months ago
Roozy
10 months ago
Roozy
10 months ago
Roozy
10 months ago

It looks like you are not logged in. Click the button below to log in and keep track of your recent history.
Support: +44 (0) 203 8794 460 | support@advfn.com
By accessing the services available at ADVFN you are agreeing to be bound by ADVFN's Terms & Conditions

 Hot Features
