4 Companies Drowning in Debt - Investment Ideas
10 August 2012 - 10:00AM
Zacks
Following the bursting of the housing bubble and subsequent
financial crisis, debt has become somewhat of a 4-letter word to
many Americans. And while there are many benefits to debt-free
living for households, in the corporate world, debt is often
desirable.
The Benefits of Debt
In order for a company to grow, it must finance
that growth. This can come from retained earnings, issuing debt, or
by selling new shares of stock. While many investors seem to prefer
debt-free balance sheets, there are actually quite a few benefits
for a company to have some debt:
- It's cheaper than equity financing.
- Interest payments are tax deductible, while dividends paid to
shareholders are not.
- Issuing debt does not dilute shareholder value, unlike issuing
new equity.
Too Much of a Good Thing...
Of course too much debt can be crippling for a
company if business turns south. The more debt financing a company
uses, the greater its risk of bankruptcy.
If a company is distressed, you can bet that those
interest payments will get sent out before any dividend checks. And
in the event of a bankruptcy, debtholders have first claim on
company assets over stockholders.
So what's the right balance of debt and equity for
a company? Ideally, a company should operate around its optimal
capital structure - where its weighted average cost of capital
(WACC) is minimized. But finding the right amount of debt-to-equity
may be more art than science.
There are ways, however, for investors to tell if a
company is carrying too much debt. And that involves looking at
various financial ratios.
Liquidity vs. Solvency
Two of the best types of ratios to consider are
liquidity and solvency ratios.
Liquidity is a measure of the firm's ability to
meet its short-term obligations. Solvency is a measure of
the firm's ability to meet its long-term obligations. It's
more of a measure of the firm's long-term survival.
Two of the most common liquidity ratios are the
Current Ratio [Current Assets / Current Liabilities] and the Quick
Ratio [(Current Assets - Inventories) / Current Liabilities]. These
will vary across industries, so it's important to compare them to
their peers. But the higher the ratios the better.
The most common solvency ratios are the Interest
Coverage Ratio [Operating Income / Interest Expense] and the
Debt/Equity ratio. The more leveraged a company is, the lower its
Interest Coverage Ratio will be and the higher its D/E ratio will
be. Again, these will depend on what industry a company operates
in. Capital-intensive businesses will typically carry larger
amounts of debt on its balance sheet. Again, it's important to
consider industry averages.
4 Companies Drowning in Debt
I ran a screen for companies with poor liquidity
and solvency ratios. While this doesn't necessarily signal imminent
bankruptcy, these four companies all appear to be cash-strapped and
overleveraged at the moment. And that's a dangerous place to be,
especially if business doesn't improve.
Charter Communications Inc (CHTR)
Current Ratio: 0.3
Quick Ratio: 0.3
Interest Coverage Ratio: 1.1
Debt/Equity: 62.7
This cable company went through bankruptcy back in
2009 and canceled all existing shares outstanding at the time.
Ouch. Charter restructured its balance sheet and went public again
the next year. But its balance sheet still isn't pretty.
Supervalu Inc (SVU)
Current Ratio: 1.0
Quick Ratio: 0.3
Interest Coverage Ratio: 1.3
Debt/Equity: 185.5
This highly leveraged grocery store chain is losing
marketshare to its rivals. The company is barely earning enough to
cover its interest expense, which leaves little left over for
shareholders. Supervalu looks like a super-value trap.
USG Corp (USG)
Current Ratio: 2.4
Quick Ratio: 1.8
Interest Coverage Ratio: 0.6
Debt/Equity: 26.9
USG Corp, which manufactures building materials,
has a fair amount of liquidity, but its solvency ratios are less
than stellar. In the first six months of this year, the company
generated $58 million in operating income. But it had to pay out
almost twice that amount in interest expense, leading to another
quarterly loss for USG.
Boyd Gaming Corp (BYD)
Current Ratio: 1.1
Quick Ratio: 1.0
Interest Coverage Ratio: 1.0
Debt/Equity: 3.4
Boyd Gaming operates hotels and casinos throughout
the United States. The company has gambled by taking on a lot of
debt, and right now it isn't paying off. Interest payments so far
this year have consumed virtually all operating profits.
The Bottom Line
For corporations, a prudent amount of debt can be
beneficial. But too much debt will increase the risks of bankruptcy
and put shareholders at risk. These 4 companies appear to be in
over their heads at the moment.
Todd Bunton is the Growth & Income Stock
Strategist for Zacks Investment Research and Editor of the Income
Plus Investor service.
BOYD GAMING CP (BYD): Free Stock Analysis Report
BOYD GAMING CP (BYD): Free Stock Analysis Report
CHARTER COMM-A (CHTR): Free Stock Analysis Report
CHARTER COMM-A (CHTR): Free Stock Analysis Report
SUPERVALU INC (SVU): Free Stock Analysis Report
SUPERVALU INC (SVU): Free Stock Analysis Report
USG CORP (USG): Free Stock Analysis Report
USG CORP (USG): Free Stock Analysis Report
To read this article on Zacks.com click here.
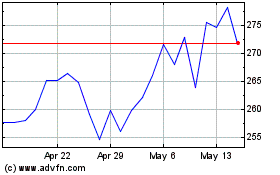
Charter Communications (NASDAQ:CHTR)
Historical Stock Chart
From Jun 2024 to Jul 2024

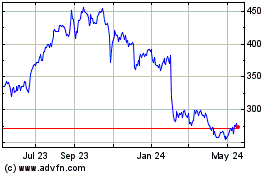
Charter Communications (NASDAQ:CHTR)
Historical Stock Chart
From Jul 2023 to Jul 2024
