1st Colonial Bancorp, Inc. (OTCBB:FCOB), holding company of 1st
Colonial National Bank, today reported that its net income for the
three months ended March 31, 2012 was $383,000 ($0.12 per share),
compared to $170,000 ($0.05 per share) for the three months ended
March 31, 2011.
Gerry Banmiller, President and Chief Executive Officer,
commented, “In prior messages I promised we would attack the cost
of deposits by reducing our Certificate of Deposit portfolio.
Kindly note that as of March 31st, the time deposit interest
expense decreased from $248,000 to $109,000. Yet, even with this
reduction, we still have a conservative loan-to-deposit ratio of
70%. Our dramatic increase in net income for the first quarter
resulted from this level of intense focus on expense control.”
He added, “We are continuing our efforts to produce more fee
income through our participation in the SBA loan program. Due to
the Small Business Administration’s guaranty of these loans, this
lending function has minimal risk to the Bank, and is therefore
made for these challenging economic times.”
At March 31, 2012, 1st Colonial also reported $282.3 million in
total assets and $247.3 million in deposits. These amounts reflect
increases of $6.2 million in assets and $6.6 million in deposits
from March 31, 2011. As noted above, the deposit mix changed as a
result of a decrease of $25.8 million in certificates of deposits
and an increase of $22.9 million in transaction accounts and $9.5
million in savings accounts. Loans were relatively unchanged at
$178.2 million.
Net interest income of $2,377,000 for the three months ended
March 31, 2012 was $224,000, or 10.4%, higher than the net interest
income of $2,153,000 for the three months ended March 31, 2011.
This was due primarily to an increase of 0.28% in net interest
spread to 3.45% for the three months ended March 31, 2012 compared
to 3.17% for the three months ended March 31, 2011.
1st Colonial’s provision for loan losses was $450,000 for the
three months ended March 31, 2012 and March 31, 2011.
Non-interest income of $399,000 for the three months ended March
31, 2012 was $12,000 higher than the first quarter of 2011.
Non-interest expense for the three months ended March 31, 2012
decreased $117,000 or 6.1% from the comparable period in 2011. FDIC
Assessments decreased $41,000, expenses related to loans in
foreclosure decreased by $38,000 and occupancy and equipment
expenses decreased by $21,000.
For the three months ended March 31, 2012, 1st Colonial had
income tax expenses of $128,000 compared to tax benefit of $12,000
for the three months ended March 31, 2011 representing an increase
of $140,000.
Highlights as of March 31, 2012 and March 31, 2011, and
comparing the three months ended March 31, 2012 and the three
months ended March 31, 2011, respectively, include the following
(dollars in thousands, except per share data):
At At $
increase/ % increase/
March 31,
2012
March 31,
2011
(decrease)
(decrease)
Total assets $ 282,317 $ 276,090 $ 6,227 2.3 % Total
loans 178,239 177,820 419 0.2 % Investments 89,223 83,329
5,894 7.1 % Total deposits 247,257 240,635 6,622 2.8 %
Shareholders' equity
24,670 23,374 1,296 5.5 %
Book value per share
$ 7.75 $ 7.34 $ 0.41 5.5 %
For the three months ended $ increase/ % increase/
March 31,
2012
March 31,
2011
(decrease)
(decrease)
Net interest income $ 2,377 $ 2,153 $ 224 10.4 %
Provision for loan losses 450 450 0 0.0 % Other income 399
387 12 3.1 % Non-interest expense 1,815 1,932 (117 ) -6.1 %
Tax expense (benefit) 128 (12 ) 140 -1,166.7 % Net
income 383 170 213 125.3 % Earnings per share, diluted $
0.12 $ 0.05 $ 0.08 140.0 %
1st Colonial National Bank, the subsidiary of 1st Colonial
Bancorp, provides a range of business and consumer financial
services, placing emphasis on customer service and access to
decision makers. Headquartered in Collingswood, New Jersey, the
Bank also has branches in the New Jersey communities of Westville
and Cinnaminson. To learn more, call (856) 858-8402 or visit
www.1stcolonial.com.
This Release contains forward-looking statements that are not
historical facts and include statements about management’s
strategies and expectations about our business. There are risks and
uncertainties that may cause our actual results and performance to
be materially different from results indicated by these
forward-looking statements. Factors that might cause a difference
include economic conditions; unanticipated loan losses, lack of
liquidity; varying and unanticipated costs of collection with
respect to nonperforming loans; changes in interest rates, changes
in FDIC assessments, deposit flows, loan demand, and real estate
values; changes in relationships with major customers; operational
risks, including the risk of fraud by employees or outsiders;
competition; changes in accounting principles, policies or
guidelines; changes in laws or regulations and in the manner in
which the regulators enforce same; new technology and other factors
affecting our operations, pricing, products and services.
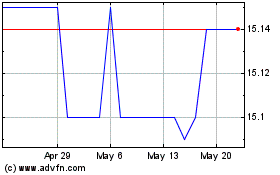
1st Colonial Bancorp (PK) (USOTC:FCOB)
Historical Stock Chart
From Jun 2024 to Jul 2024

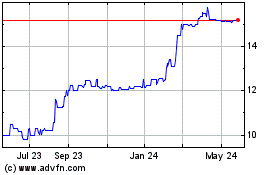
1st Colonial Bancorp (PK) (USOTC:FCOB)
Historical Stock Chart
From Jul 2023 to Jul 2024
