TIDMPEW TIDMPEWZ 
 
Premier Energy and Water Trust PLC announces that at close of business on 30 
October 2015 its twenty largest investments were as follows: 
 
 
                                                 % of total assets 
 
OPG Power Ventures                                             7.7 
 
China Power Intl. Develop                                      5.0 
 
Renewable Energy Generation                                    4.4 
 
National Grid                                                  4.0 
 
Nextera Energy                                                 3.6 
 
SSE PLC                                                        3.6 
 
First Trust MLP and Energy Income Fund                         3.4 
 
Beijing Enterprises Holdings                                   3.3 
 
China Everbright Intl.                                         3.2 
 
Engie                                                          3.0 
 
iShares Global Utilities ETF                                   2.9 
 
Qatar Electricity & Water                                      2.7 
 
Enersis                                                        2.6 
 
EDP - Energias do Brasil                                       2.5 
 
Greenko Group Ord and 8% Bond*                                 2.4 
 
Pennon Group                                                   2.3 
 
ACEA                                                           2.1 
 
TerraForm Global 9.75% Bond 15/08/2022                         1.9 
 
Tenaga Nasional Berhad                                         1.8 
 
Consolidated Edison                                            1.7 
 
 
* Holding in both convertible bond and equity 
 
At close of business on 30 October 2015 the total net assets of Premier Energy 
and Water Trust PLC amounted to GBP76.4 million. The sector breakdown and 
geographical allocation were as follows: 
 
Sector Breakdown: 
 
Electricity                                      48.9% 
 
Multi Utilities                                  18.5% 
 
Water & Waste                                     8.2% 
 
Gas                                               5.6% 
 
Cash/Net Current Assets                           7.9% 
 
Renewable Energy                                 10.6% 
 
Index Options                                     0.3% 
 
Total                                           100.0% 


Geographical Allocation: 
 
Europe (excluding UK)                             4.9% 
 
China                                            16.9% 
 
North America                                    16.6% 
 
Global                                            7.9% 
 
Asia (excluding China)                           15.3% 
 
United Kingdom                                   16.5% 
 
Latin America                                     6.6% 
 
Cash/Net Current Assets                           7.9% 
 
Eastern Europe                                    4.4% 
 
Middle East                                       2.7% 
 
Index Options                                     0.3% 


END 
 

(END) Dow Jones Newswires

November 03, 2015 08:37 ET (13:37 GMT)

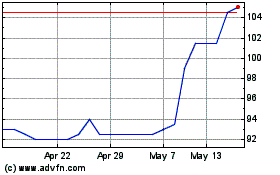
Premier Miton Global Ren... (LSE:PMGR)
Historical Stock Chart
From Apr 2024 to May 2024 Click Here for more Premier Miton Global Ren... Charts.
Premier Miton Global Ren... (LSE:PMGR)
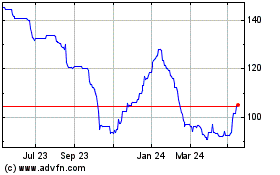
Historical Stock Chart
From May 2023 to May 2024 Click Here for more Premier Miton Global Ren... Charts.