
We could not find any results for:
Make sure your spelling is correct or try broadening your search.
EDISON EQUITY RESEARCH: ANGLE: ADR UPDATE - THIRD CLINICAL APPLICATION EMERGESAngle has announced results from a metastatic breast cancer research study carried out by its KOL partner...
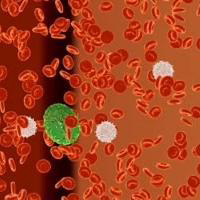
EDISON EQUITY RESEARCH: ANGLE - CELLS FOR PRECISION MEDICINEAngle has transformed into a pure-play diagnostics business. Parsortix, its proprietary cell separation system, can be used to capture...
ANGLE plc's Parsortix System Harvests CTCS In 100% Of Prostate Cancer Patients Barts study demonstrates Parsortix harvested cells are clinically relevant in prostate cancer PR Newswire GUILDFORD...
ANGLE plc appoints Jim Reuben Scientific Adviser PR Newswire GUILDFORD, England, June 3, 2015 GUILDFORD, England, June 3, 2015 /PRNewswire/ -- ANGLE plc (AIM: AGL) (OTCQX: ANPCY), the specialist...
ANGLE plc Updates Results on Ovarian Cancer Study PR Newswire GUILDFORD, United Kingdom, April 21, 2015 GUILDFORD, United Kingdom, April 21, 2015 /PRNewswire/ -- ANGLE plc (AIM:AGL OTCQX:ANPCY...
Results From The Sidney Kimmel Cancer Center At Thomas Jefferson University PR Newswire GUILDFORD, England, April 20, 2015 GUILDFORD, England, April 20, 2015 /PRNewswire/ -- ANGLE plc (AIM:AGL...
S&P Capital IQ Initiates Coverage on ANGLE Plc in S&P Capital IQ Factual Stock Reports PR Newswire NEW YORK, March 16, 2015 NEW YORK, March 16, 2015 /PRNewswire/ -- S&P Capital IQ...
ANGLE plc ("Angle" or "the Company") Collaboration With MD Anderson Cancer Center On Colorectal Cancer PR Newswire GUILDFORD, England, Feb. 16, 2015 GUILDFORD, England, Feb...
| Period | Change | Change % | Open | High | Low | Avg. Daily Vol | VWAP | |
|---|---|---|---|---|---|---|---|---|
| 1 | 0 | 0 | 0 | 0 | 0 | 0 | 0 | CS |
| 4 | 0 | 0 | 1.35 | 1.35 | 1.35 | 754 | 1.35 | CS |
| 12 | 0.6138 | 83.3740831296 | 0.7362 | 1.52 | 0.7362 | 963 | 1.15044762 | CS |
| 26 | -0.87 | -39.1891891892 | 2.22 | 2.44 | 0.7362 | 1393 | 1.4173319 | CS |
| 52 | -0.82 | -37.7880184332 | 2.17 | 3.35 | 0.7362 | 1437 | 1.97256344 | CS |
| 156 | -13.43 | -90.8660351827 | 14.78 | 21 | 0.7362 | 1207 | 2.44042124 | CS |
| 260 | -7.85 | -85.3260869565 | 9.2 | 21 | 0.7362 | 992 | 3.54414301 | CS |
 HappyAlways
14 minutes ago
HappyAlways
14 minutes ago
 10thMountain
16 minutes ago
10thMountain
16 minutes ago
 mrfence
19 minutes ago
wickw50
23 minutes ago
lodas
24 minutes ago
RichieBoy
24 minutes ago
mrfence
19 minutes ago
wickw50
23 minutes ago
lodas
24 minutes ago
RichieBoy
24 minutes ago
 lakers17
26 minutes ago
lakers17
26 minutes ago
 TradingCharts
27 minutes ago
TradingCharts
27 minutes ago
 TONTOYO
29 minutes ago
TONTOYO
29 minutes ago
 Squirrely_McShitty
33 minutes ago
Squirrely_McShitty
33 minutes ago
 jhnvtjll
36 minutes ago
Babubd
39 minutes ago
primewa
39 minutes ago
mrfence
42 minutes ago
ysung
43 minutes ago
Babubd
44 minutes ago
Babubd
46 minutes ago
MagnetLover
47 minutes ago
HappyAlways
48 minutes ago
jhnvtjll
36 minutes ago
Babubd
39 minutes ago
primewa
39 minutes ago
mrfence
42 minutes ago
ysung
43 minutes ago
Babubd
44 minutes ago
Babubd
46 minutes ago
MagnetLover
47 minutes ago
HappyAlways
48 minutes ago
 IceCold8
49 minutes ago
IceCold8
49 minutes ago
 RickNagra
51 minutes ago
RickNagra
51 minutes ago
 JMCK6193
52 minutes ago
weedtrader420
53 minutes ago
weedtrader420
53 minutes ago
JMCK6193
52 minutes ago
weedtrader420
53 minutes ago
weedtrader420
53 minutes ago

It looks like you are not logged in. Click the button below to log in and keep track of your recent history.
Support: +44 (0) 203 8794 460 | support@advfn.com
By accessing the services available at ADVFN you are agreeing to be bound by ADVFN's Terms & Conditions

 Hot Features
