
We could not find any results for:
Make sure your spelling is correct or try broadening your search.
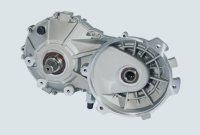
Greenland Technologies Holding Corp is a developer of innovative and quality solutions in the material handling industry. It is a transmission and drivetrain systems provider for material handling equipment such as forklift trucks for industrial and logistic applications. The company sold more than ... Greenland Technologies Holding Corp is a developer of innovative and quality solutions in the material handling industry. It is a transmission and drivetrain systems provider for material handling equipment such as forklift trucks for industrial and logistic applications. The company sold more than 108000 sets of transmission systems to over 100 forklift manufacturers in China. With the emphasis on quality and innovation, over the years, Greenland gained the trust and loyalty from its customers. Show more
Greenland Reports 75.3% Increase in Net Income for First Nine Months of 2024 PR Newswire EAST WINDSOR, N.J., Nov. 14, 2024 Revenue for the First Nine Months of 2024 of $64.57 Million, Decreases...
HEVI Announces Transition to a More Aggressive Dealer Model to Meet Strong Customer Demand for its Electric Industrial Equipment PR Newswire EAST WINDSOR, N.J., Oct. 1, 2024 EAST WINDSOR, N.J...
HEVI Unveils North America's Largest All-Electric Wheel Loader: Game-Changing H65L Delivers Zero Emissions, Lower Costs, and Uncompromised Performance PR Newswire EAST WINDSOR, N.J., Aug. 28...
HEVI Launches H55L Electric Front Wheel Loader; Newest Model Expected to Save Customers by Materially Reducing Diesel and Planned Maintenance Expenses PR Newswire EAST WINDSOR, N.J., Aug. 27...
Greenland Reports 99.7% YoY Increase in 2Q 2024 Net Income PR Newswire EAST WINDSOR, N.J., Aug. 15, 2024 Drives Gross Margin Stability and Expense ReductionsIntroduces Incentives to Accelerate...
Assurant Partners with HEVI to Provide Extended Service Contracts PR Newswire EAST WINDSOR, N.J., July 23, 2024 EAST WINDSOR, N.J., July 23, 2024 /PRNewswire/ -- HEVI Corp. ("HEVI" or the...
National Energy Improvement Fund Partners with HEVI to Provide Equipment Financing PR Newswire EAST WINDSOR, N.J., July 17, 2024 EAST WINDSOR, N.J., July 17, 2024 /PRNewswire/ -- HEVI Corp...
Greenland Technologies and Lonking Join Forces to Develop Heavy Electric Machinery for the U.S. Market Under the HEVI Brand PR Newswire EAST WINDSOR, N.J., July 16, 2024 EAST WINDSOR, N.J., July...
| Period | Change | Change % | Open | High | Low | Avg. Daily Vol | VWAP | |
|---|---|---|---|---|---|---|---|---|
| 1 | -0.35 | -13.2575757576 | 2.64 | 2.64 | 2.23 | 116995 | 2.35989734 | CS |
| 4 | 0.38 | 19.8952879581 | 1.91 | 2.92 | 1.75 | 347913 | 2.32842538 | CS |
| 12 | 0.11 | 5.04587155963 | 2.18 | 2.92 | 1.75 | 177111 | 2.23520262 | CS |
| 26 | 0.91 | 65.9420289855 | 1.38 | 2.9365 | 1.38 | 453556 | 2.21617894 | CS |
| 52 | -0.95 | -29.3209876543 | 3.24 | 3.69 | 1.36 | 248598 | 2.19489444 | CS |
| 156 | -2.83 | -55.2734375 | 5.12 | 6.3 | 1.13 | 135471 | 2.41911251 | CS |
| 260 | -1.44 | -38.6058981233 | 3.73 | 26.42 | 1.12 | 572887 | 7.61182648 | CS |
 oxnous
3 years ago
oxnous
3 years ago
 Atom Smasher
3 years ago
trendzone
3 years ago
oxnous
3 years ago
trendzone
3 years ago
trendzone
3 years ago
Atom Smasher
3 years ago
trendzone
3 years ago
oxnous
3 years ago
trendzone
3 years ago
trendzone
3 years ago
 crudeoil24
3 years ago
tw0122
3 years ago
tw0122
3 years ago
tw0122
3 years ago
crudeoil24
3 years ago
crudeoil24
3 years ago
tw0122
3 years ago
crudeoil24
3 years ago
crudeoil24
3 years ago
crudeoil24
3 years ago
crudeoil24
3 years ago
tw0122
3 years ago
tw0122
3 years ago
tw0122
3 years ago
crudeoil24
3 years ago
crudeoil24
3 years ago
tw0122
3 years ago
crudeoil24
3 years ago
crudeoil24
3 years ago
crudeoil24
3 years ago
 TheFinalCD
3 years ago
makinezmoney
3 years ago
TheFinalCD
3 years ago
makinezmoney
3 years ago
 MADDSTACKER
4 years ago
MADDSTACKER
4 years ago
 TrendTrade2016
3 weeks ago
TrendTrade2016
3 weeks ago
TrendTrade2016
4 weeks ago
TrendTrade2016
4 weeks ago
TrendTrade2016
3 months ago
TrendTrade2016
4 months ago
TrendTrade2016
3 weeks ago
TrendTrade2016
3 weeks ago
TrendTrade2016
4 weeks ago
TrendTrade2016
4 weeks ago
TrendTrade2016
3 months ago
TrendTrade2016
4 months ago
 glenn1919
6 months ago
Invest-in-America
6 months ago
Awl416
6 months ago
glenn1919
6 months ago
Invest-in-America
6 months ago
Awl416
6 months ago
 Monksdream
11 months ago
TrendTrade2016
1 year ago
TrendTrade2016
1 year ago
Awl416
1 year ago
TrendTrade2016
1 year ago
TrendTrade2016
1 year ago
TrendTrade2016
1 year ago
TrendTrade2016
1 year ago
Awl416
1 year ago
Awl416
1 year ago
Awl416
1 year ago
Awl416
1 year ago
OmegaMoney29
1 year ago
OmegaMoney29
1 year ago
Awl416
1 year ago
Monksdream
11 months ago
TrendTrade2016
1 year ago
TrendTrade2016
1 year ago
Awl416
1 year ago
TrendTrade2016
1 year ago
TrendTrade2016
1 year ago
TrendTrade2016
1 year ago
TrendTrade2016
1 year ago
Awl416
1 year ago
Awl416
1 year ago
Awl416
1 year ago
Awl416
1 year ago
OmegaMoney29
1 year ago
OmegaMoney29
1 year ago
Awl416
1 year ago
 BottomBounce
1 year ago
Awl416
2 years ago
plexrr
3 years ago
plexrr
3 years ago
plexrr
3 years ago
oxnous
3 years ago
Atom Smasher
3 years ago
BottomBounce
1 year ago
Awl416
2 years ago
plexrr
3 years ago
plexrr
3 years ago
plexrr
3 years ago
oxnous
3 years ago
Atom Smasher
3 years ago

It looks like you are not logged in. Click the button below to log in and keep track of your recent history.
Support: +44 (0) 203 8794 460 | support@advfn.com
By accessing the services available at ADVFN you are agreeing to be bound by ADVFN's Terms & Conditions

 Hot Features
