 Woodpecker3
2 months ago
Woodpecker3
2 months ago
Because we will incur costs and expenses from these and other efforts before we receive significant licensing revenue, we expect to incur losses in future periods, which could be significant. In addition, we may find that these efforts are more expensive than we currently anticipate or that these efforts may result in less than expected or no additional revenue, which would further increase our losses and affect our ability to continue operations. We may have to obtain additional capital from external sources, and additional financing may not be available when needed or, if available, may not be available on terms favorable to us or to our stockholders. See “Our business plans require a significant amount of capital. Our future capital needs may require us to sell additional equity or debt securities that may dilute our stockholders or introduce covenants that may restrict our operations or our ability to pay dividends. If we require additional capital and are not able to secure new funding, we may not be able to continue our business operations.”
Woodpecker3
2 months ago
We have incurred losses and negative cash flows from operations since inception and are likely to continue to incur losses and negative cash flows from operations in the near term. We incurred a net loss of $19.6 million for the nine months ended September 30, 2024, and a net loss of $115.6 million for the year ended December 31, 2023. As of September 30, 2024, we had an accumulated deficit of $437.9 million and working capital of $19.8 million. We believe that we are likely to continue to incur operating and net losses, which could be significant, for the foreseeable future. Our shift in product development and commercialization strategy to focus on our AI/ML Software Platform and related products has affected the timing of expected revenue and has made forecasting our quarterly and annual results more challenging. Even if we are able to successfully develop our AI/ML Software Platform and related products and attract customers for commercial sales, we may not become profitable. Our potential profitability is dependent upon the successful development, commercial introduction and adoption on a large scale of our AI/ML Software Platform and related products and our ability to lower costs, none of which may occur. We may not be successful in achieving meaningful revenues from these products. Further, the timing, amount and growth rate of any such revenues are unknown.
 georgie18
2 months ago
georgie18
2 months ago
PDYN...$8.42...🥳...Hit my target...all out here...will revisit...
georgie18
Member Level
Re: georgie18 post# 668846
Thursday, December 26, 2024 10:11:02 AM
Post#
668886
of 668889
PDYN...$7.22...🥳...Took 1/2 off the table here ...still looking for $8 plus...
georgie18
Member Level
Re: georgie18 post# 63
Thursday, December 26, 2024 8:20:41 AM
Post#
65
of 72
PDYN...$5.91...🥳...Off my $3.50 Gap Alert...
georgie18
Member Level
Re: georgie18 post# 667831
Tuesday, December 24, 2024 1:40:00 PM
Post#
668776
of 668845
PDYN...$4.86...🥳...Bullish Psar Flip...Still looking for $8 Plus...
georgie18
Member Level
Re: georgie18 post# 50
Monday, December 16, 2024 11:35:30 AM
Post#
56
of 63
PDYN...$4.18...🥳...Bullish Engulfing Reversal Candle setting up here...Off my $3.50 Gap Alert...
georgie18
Member Level
Re: georgie18 post# 667703
Monday, December 16, 2024 9:56:52 AM
Post#
667813
of 667830
PDYN...$3.94...🥳...Off the $3.50 range Gap fill...
georgie18
Member Level
Re: georgie18 post# 47
Friday, December 13, 2024 9:40:25 AM
Post#
48
of 49
PDYN...$3.49...Hit my $3.50 target Alert...🥳
georgie18
Member Level
Re: Monksdream post# 667506
Wednesday, December 11, 2024 10:29:17 AM
Post#
667521
of 667702
PDYN...$3.85...🥳Hit my $3.60/$3.70 range bids this morning...Chart call was spot on...
georgie18
Member Level
Re: None
Friday, December 06, 2024 2:16:36 PM
Post#
667143
of 667519
PDYN...$4.34...🥳...Bearish Psar Flip... https://schrts.co/hUxxMUBa ...Looking for $3.50 range entry on the Bullish Pole N Flag set up...
georgie18
2 months ago
PDYN...$7.22...🥳...Took 1/2 off the table here ...still looking for $8 plus...
georgie18
Member Level
Re: georgie18 post# 63
Thursday, December 26, 2024 8:20:41 AM
Post#
65
of 72
PDYN...$5.91...🥳...Off my $3.50 Gap Alert...
georgie18
Member Level
Re: georgie18 post# 667831
Tuesday, December 24, 2024 1:40:00 PM
Post#
668776
of 668845
PDYN...$4.86...🥳...Bullish Psar Flip...Still looking for $8 Plus...
georgie18
Member Level
Re: georgie18 post# 50
Monday, December 16, 2024 11:35:30 AM
Post#
56
of 63
PDYN...$4.18...🥳...Bullish Engulfing Reversal Candle setting up here...Off my $3.50 Gap Alert...
georgie18
Member Level
Re: georgie18 post# 667703
Monday, December 16, 2024 9:56:52 AM
Post#
667813
of 667830
PDYN...$3.94...🥳...Off the $3.50 range Gap fill...
georgie18
Member Level
Re: georgie18 post# 47
Friday, December 13, 2024 9:40:25 AM
Post#
48
of 49
PDYN...$3.49...Hit my $3.50 target Alert...🥳
georgie18
Member Level
Re: Monksdream post# 667506
Wednesday, December 11, 2024 10:29:17 AM
Post#
667521
of 667702
PDYN...$3.85...🥳Hit my $3.60/$3.70 range bids this morning...Chart call was spot on...
georgie18
Member Level
Re: None
Friday, December 06, 2024 2:16:36 PM
Post#
667143
of 667519
PDYN...$4.34...🥳...Bearish Psar Flip... https://schrts.co/hUxxMUBa ...Looking for $3.50 range entry on the Bullish Pole N Flag set up...
 tw0122
2 months ago
tw0122
2 months ago
$6.56.. Palladyne AI Achieves Key Milestone with First Small Drone Autonomous Tracking Flight
December 23 2024 - 9:00AM
Business Wire
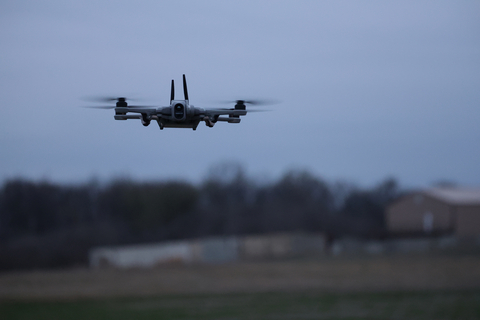
Palladyne Pilot AI Software Platform Enables Third-Party Drone to Identify, Prioritize, and Autonomously Track Terrestrial TargetsPalladyne AI Corp. (NASDAQ: PDYN and PDYNW) (“Palladyne AI”), a developer of artificial intelligence software for robotic and unmanned platforms in the industrial and defense sectors, today announced that its Palladyne™️ Pilot AI software platform has achieved a key developmental milestone with the successful first flight of a third-party small drone that demonstrated the ability to identify and prioritize terrestrial targets of interest and then interface with the drone’s autopilot software to follow the prioritized target autonomously.Palladyne AI had previously successfully demonstrated the Palladyne Pilot AI platform’s ability to identify and prioritize targets on stationary nodes and with hovering drones. Last week’s test flight was the first to successfully integrate with third-party autopilot software to autonomously control the drone's navigation while identifying, prioritizing, tracking, and following the desired target.“Our first autonomous flight with Palladyne Pilot was able to track and follow a target, successfully demonstrating how powerful our AI platform can be by automating those functions where algorithms and machines excel, while still leaving ultimate control in the hands of humans,” said Dr. Denis Garagic, co-founder and CTO, Palladyne AI. “Once we complete commercialization of Palladyne Pilot -- which we expect to happen by the end of the first quarter of 2025 -- small, economical drones will finally offer some of the same intelligence capabilities that larger, multi-million-dollar unmanned systems have had for years.”About Palladyne PilotThe Palladyne Pilot AI Software Platform for UAVs transforms unmanned, tactical systems into highly efficient, autonomous force multipliers capable of persistent target tracking, dynamic collaboration, and enhanced situational awareness. With advanced perception, learning, and autonomous capabilities designed to reduce operational burden while dramatically improving mission effectiveness for military and defense operations, Palladyne Pilot stands ready to support and deliver mission effectiveness and success.The development and continued advancement of Palladyne Pilot is the result of multiple contracts with the U.S. Air Force. From inception, Pilot was designed to be a collaborative sensing platform for small drone platforms and is one of the pillars, along with Palladyne IQ, of Palladyne AI’s technology offerings.
georgie18
2 months ago
PDYN...$5.91...🥳...Off my $3.50 Gap Alert...
georgie18
Member Level
Re: georgie18 post# 667831
Tuesday, December 24, 2024 1:40:00 PM
Post#
668776
of 668845
PDYN...$4.86...🥳...Bullish Psar Flip...Still looking for $8 Plus...
georgie18
Member Level
Re: georgie18 post# 50
Monday, December 16, 2024 11:35:30 AM
Post#
56
of 63
PDYN...$4.18...🥳...Bullish Engulfing Reversal Candle setting up here...Off my $3.50 Gap Alert...
georgie18
Member Level
Re: georgie18 post# 667703
Monday, December 16, 2024 9:56:52 AM
Post#
667813
of 667830
PDYN...$3.94...🥳...Off the $3.50 range Gap fill...
georgie18
Member Level
Re: georgie18 post# 47
Friday, December 13, 2024 9:40:25 AM
Post#
48
of 49
PDYN...$3.49...Hit my $3.50 target Alert...🥳
georgie18
Member Level
Re: Monksdream post# 667506
Wednesday, December 11, 2024 10:29:17 AM
Post#
667521
of 667702
PDYN...$3.85...🥳Hit my $3.60/$3.70 range bids this morning...Chart call was spot on...
georgie18
Member Level
Re: None
Friday, December 06, 2024 2:16:36 PM
Post#
667143
of 667519
PDYN...$4.34...🥳...Bearish Psar Flip... https://schrts.co/hUxxMUBa ...Looking for $3.50 range entry on the Bullish Pole N Flag set up...
georgie18
2 months ago
PDYN...$4.86...🥳...Bullish Psar Flip...Still looking for $8 Plus...
georgie18
Member Level
Re: georgie18 post# 50
Monday, December 16, 2024 11:35:30 AM
Post#
56
of 63
PDYN...$4.18...🥳...Bullish Engulfing Reversal Candle setting up here...Off my $3.50 Gap Alert...
georgie18
Member Level
Re: georgie18 post# 667703
Monday, December 16, 2024 9:56:52 AM
Post#
667813
of 667830
PDYN...$3.94...🥳...Off the $3.50 range Gap fill...
georgie18
Member Level
Re: georgie18 post# 47
Friday, December 13, 2024 9:40:25 AM
Post#
48
of 49
PDYN...$3.49...Hit my $3.50 target Alert...🥳
georgie18
Member Level
Re: Monksdream post# 667506
Wednesday, December 11, 2024 10:29:17 AM
Post#
667521
of 667702
PDYN...$3.85...🥳Hit my $3.60/$3.70 range bids this morning...Chart call was spot on...
georgie18
Member Level
Re: None
Friday, December 06, 2024 2:16:36 PM
Post#
667143
of 667519
PDYN...$4.34...🥳...Bearish Psar Flip... https://schrts.co/hUxxMUBa ...Looking for $3.50 range entry on the Bullish Pole N Flag set up...
tw0122
2 months ago
Nice $3s dip back today $4.84... Dr. Smith beneficially owns an aggregate of 1,625,845 shares of Common Stock, or 5.40%, of the Issuer's outstanding shares of Common Stock, consisting of: * 1,615,503 shares of Common Stock; and * 10,342 shares of Common Stock underlying options exercisable within 60 days of December 23, 2024. Dr. Smith has sole voting and dispositive power over the 1,625,845 shares of Common Stock. The beneficial ownership percentages used in this Schedule are calculated based o


 BIOCHEMUP
1 month ago
BIOCHEMUP
1 month ago
 aljafy
1 month ago
aljafy
1 month ago
 Monksdream
1 month ago
Monksdream
1 month ago
 glenn1919
2 months ago
glenn1919
2 months ago
 TrendTrade2016
2 months ago
TrendTrade2016
2 months ago


 Hot Features
