RiseandShine
4 years ago
RiseandShine
4 years ago
October 29 2020 - 06:28PM Fisker Inc. (“Fisker”), a developer of the world’s most emotionally desirable, eco-friendly electric vehicles, announced today that it has completed its business combination (“Business Combination”) with Spartan Energy Acquisition Corp. (“Spartan”) (NYSE:SPAQ), a special purpose acquisition company sponsored by an affiliate of Apollo Global Management, Inc. (NYSE:APO). Spartan stockholders approved the business combination in a special meeting held on Oct. 28, 2020. On Oct. 30, 2020, the combined company’s Class A common stock and public warrants are expected to commence trading on the New York Stock Exchange (“NYSE”) under the ticker symbols “FSR” and “FSR WS,” respectively.
“All the external pieces are now in place to execute our unique, asset-light business strategy, with today’s funding and the strategic cooperation announced with Magna on Oct. 15,” commented Fisker Chairman and Chief Executive Officer, Henrik Fisker. “We can now fully turn our attention to developing and launching the revolutionary, all-electric Fisker Ocean into the heart of the midsize SUV market, expected to commence in Q4 2022. We appreciate the confidence from all our shareholders and intend to deliver on our stated goals.”
As a result of the completion of the transaction, Fisker expects to have in excess of $1.0 billion (net of transaction fees and expenses) of cash on the balance sheet and no funded debt. This amount is expected to fully fund Fisker operations and the development of the Fisker Ocean program through the planned start of production in Q4 2022.
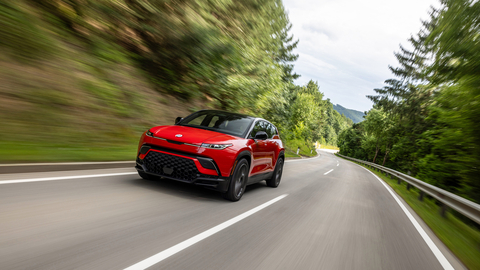
The Fisker Ocean has been designed to be the world’s most sustainable vehicle, including extensive use of environmentally friendly and recycled materials. The model is also digitally focused, reflected through innovative features delivered “over-the-air,” a groundbreaking user interface / user experience and an ownership experience that can be fully managed through the Fisker Flexee app. A strategic cooperation with Magna International supports the co-development and manufacture of the vehicle projected to launch in Q4 2022.
The Ocean will be assembled by Magna in Europe and is poised to deliver class-leading range, interior space (with optional third-row seating) and overall vehicle performance at a compelling starting MSRP of $37,499. Joint engineering work with Magna is in full gear after kicking off in September, with Fisker recently announcing that a production-intent prototype will be unveiled at the Los Angeles Auto Show in May 2021. Fisker has received approximately 9,000 paid reservations as of Oct. 29, 2020, following a meaningful increase in order rate over the last several weeks. Fisker plans to increase organic marketing activities over the course of 2021, which the company expects to result in the continued increase to the order backlog.
About Fisker Inc.
California-based Fisker Inc. is revolutionizing the automotive industry by developing the most emotionally desirable and eco-friendly electric vehicles on Earth. Passionately driven by a vision of a clean future for all, the company is on a mission to become the No. 1 e-mobility service provider with the world’s most sustainable vehicles. To learn more and to reserve the all-electric Fisker Ocean, visit www.FiskerInc.com.
Forward Looking Statements
This press release includes forward-looking statements. These statements are made under the “safe harbor” provisions of the U.S. Private Securities Litigation Reform Act of 1995. These statements may be identified by words such as “feel,” “believes,” expects,” “estimates,” “projects,” “intends,” “should,” “is to be,” or the negative of such terms, or other comparable terminology. Forward-looking statements are statements that are not historical facts. Such forward-looking statements are not guarantees of future performance and are subject to risks and uncertainties, which could cause actual results to differ materially from the forward-looking statements contained herein due to many factors, including, but not limited to: Fisker’s limited operating history; Fisker’s ability to enter into platform and manufacturing contracts with Magna International Inc., or other OEMs or tier-one suppliers in order to execute on its business plan; Fisker’s ability to execute its business model, including market acceptance of its planned products and services; Fisker’s inability to retain key personnel and to hire additional personnel; competition in the electric vehicle market; Fisker’s inability to develop a sales distribution network; and the ability to protect its intellectual property rights. Any forward-looking statements speak only as of the date on which they are made, and Fisker undertakes no obligation to update any forward-looking statement to reflect events or circumstances after the date of this press release.
View source version on businesswire.com: https://www.businesswire.com/news/home/20201029006346/en/
Fisker Inc.
Simon Sproule, VP, Communications
310.374.6177
Fisker@GoDRIVEN360.com
Dan Galves, VP, Investor Relations
dgalves@fiskerinc.com
FiskerIR@icrinc.com


 threebabiesbusy
11 months ago
threebabiesbusy
11 months ago
 highstakes
11 months ago
highstakes
11 months ago
 TradeSmart.ai
4 years ago
TradeSmart.ai
4 years ago
 TheFinalCD
4 years ago
TheFinalCD
4 years ago
 Crazy Money
4 years ago
Crazy Money
4 years ago
 Penny Roger$
13 years ago
Penny Roger$
13 years ago


 Hot Features