We could not find any results for:
Make sure your spelling is correct or try broadening your search.

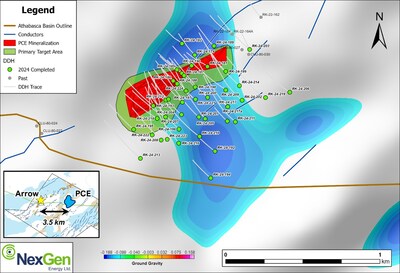
NexGen Energy Ltd is a mineral exploration company. It is engaged in the acquisition, exploration, evaluation and development of uranium properties in Canada. The company's projects portfolio consists of ROOK I, Radio Property, and the IsoEnergy, at the Athabasca Basin. The Rook I property hosts the... NexGen Energy Ltd is a mineral exploration company. It is engaged in the acquisition, exploration, evaluation and development of uranium properties in Canada. The company's projects portfolio consists of ROOK I, Radio Property, and the IsoEnergy, at the Athabasca Basin. The Rook I property hosts the world-class Arrow Zone, the Bow discovery. as well as the discovered Harpoon area located northeast of the Arrow deposit. Show more


| Period | Change | Change % | Open | High | Low | Avg. Daily Vol | VWAP | |
|---|---|---|---|---|---|---|---|---|
| 1 | 0.01 | 0.204081632653 | 4.9 | 4.95 | 4.44 | 10589167 | 4.71539826 | CS |
| 4 | -1.55 | -23.9938080495 | 6.46 | 6.5 | 4.44 | 11475254 | 5.19270639 | CS |
| 12 | -1.95 | -28.4256559767 | 6.86 | 7.715 | 4.44 | 9155234 | 6.07924944 | CS |
| 26 | -0.8344 | -14.5254508739 | 5.7444 | 8.97 | 4.44 | 7454194 | 6.72394765 | CS |
| 52 | -2.23 | -31.2324929972 | 7.14 | 8.97 | 4.44 | 6296322 | 6.89148379 | CS |
| 156 | -0.6 | -10.889292196 | 5.51 | 8.97 | 3.3908 | 4324900 | 6.16977531 | CS |
| 260 | -7.96 | -61.8492618493 | 12.87 | 12.87 | 3.3908 | 2596540 | 6.16498621 | CS |
 joe_techi
4 days ago
FuzzyValue
1 month ago
Oleblue
2 months ago
joe_techi
4 days ago
FuzzyValue
1 month ago
Oleblue
2 months ago
 levi
1 year ago
4Godnwv
3 years ago
levi
1 year ago
4Godnwv
3 years ago
 scaryharrysafari
3 years ago
scaryharrysafari
3 years ago
 stocktrademan
3 years ago
stocktrademan
3 years ago
 Pennybuster
4 years ago
Pennybuster
4 years ago
 masslanding
4 years ago
Pennybuster
5 years ago
masslanding
4 years ago
Pennybuster
5 years ago
 whytestocks
6 years ago
joe_techi
6 years ago
joe_techi
6 years ago
joe_techi
6 years ago
whytestocks
6 years ago
joe_techi
6 years ago
joe_techi
6 years ago
joe_techi
6 years ago
 Shortnlongs
6 years ago
joe_techi
6 years ago
Shortnlongs
6 years ago
joe_techi
6 years ago
Shortnlongs
6 years ago
Shortnlongs
6 years ago
joe_techi
6 years ago
Shortnlongs
6 years ago
joe_techi
6 years ago
Shortnlongs
6 years ago
 RPMcKenna1976
7 years ago
RPMcKenna1976
7 years ago
 StockProfiteer
7 years ago
StockProfiteer
7 years ago

It looks like you are not logged in. Click the button below to log in and keep track of your recent history.
Support: +44 (0) 203 8794 460 | support@advfn.com
By accessing the services available at ADVFN you are agreeing to be bound by ADVFN's Terms & Conditions

 Hot Features