
We could not find any results for:
Make sure your spelling is correct or try broadening your search.

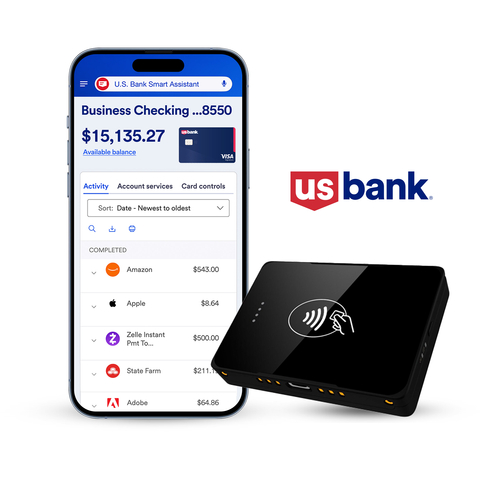
U.S. Bancorp with nearly 70000 employees and $554 billion in assets as of December 31 2020 is the parent company of U.S. Bank National Association the fifth-largest commercial bank in the United States. The Minneapolis-based bank blends its relationship teams branches and ATM network with digital to... U.S. Bancorp with nearly 70000 employees and $554 billion in assets as of December 31 2020 is the parent company of U.S. Bank National Association the fifth-largest commercial bank in the United States. The Minneapolis-based bank blends its relationship teams branches and ATM network with digital tools that allow customers to bank when where and how they prefer. U.S. Bank is committed to serving its millions of retail business wealth management payment commercial corporate and investment customers across the country and around the world as a trusted and responsible financial partner. This commitment continues to earn a spot on the Ethisphere Institutes Worlds Most Ethical Companies list and puts U.S. Bank in the top 5% of global companies assessed on the CDP A List for climate change action. Visit usbank.com for more. Show more
| Period | Change | Change % | Open | High | Low | Avg. Daily Vol | VWAP | |
|---|---|---|---|---|---|---|---|---|
| 1 | 1.44 | 3.76569037657 | 38.24 | 39.75 | 37.245 | 13221276 | 38.08723487 | CS |
| 4 | -4.1 | -9.36500685244 | 43.78 | 44.455 | 35.18 | 14085571 | 38.95472504 | CS |
| 12 | -9.92 | -20 | 49.6 | 49.76 | 35.18 | 11454581 | 42.64349015 | CS |
| 26 | -8.06 | -16.8831168831 | 47.74 | 53.98 | 35.18 | 9536082 | 45.66929017 | CS |
| 52 | -1 | -2.45821042281 | 40.68 | 53.98 | 35.18 | 8801555 | 44.46141707 | CS |
| 156 | -12.96 | -24.6200607903 | 52.64 | 53.98 | 27.27 | 10198560 | 40.75381961 | CS |
| 260 | 6.17 | 18.4124142047 | 33.51 | 63.57 | 27.27 | 8866910 | 43.4016353 | CS |
 fung_derf
1 week ago
fung_derf
1 week ago
 Newtogame
1 week ago
Newtogame
1 week ago
 trunkmonk
2 weeks ago
trunkmonk
2 weeks ago
 BottomBounce
2 weeks ago
BottomBounce
8 months ago
BottomBounce
2 weeks ago
BottomBounce
8 months ago
 $27
5 years ago
$27
7 years ago
$27
8 years ago
$27
8 years ago
$27
5 years ago
$27
7 years ago
$27
8 years ago
$27
8 years ago
 Penny Roger$
13 years ago
Ill like Kobe
13 years ago
Penny Roger$
13 years ago
Penny Roger$
13 years ago
Penny Roger$
13 years ago
Ill like Kobe
13 years ago
Penny Roger$
13 years ago
Penny Roger$
13 years ago

It looks like you are not logged in. Click the button below to log in and keep track of your recent history.
Support: +44 (0) 203 8794 460 | support@advfn.com
By accessing the services available at ADVFN you are agreeing to be bound by ADVFN's Terms & Conditions

 Hot Features

