

We could not find any results for:
Make sure your spelling is correct or try broadening your search.
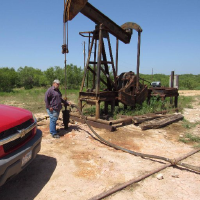
Northern Minerals & Exploration Ltd. is an emerging an emerging publicly traded company focused on oil and gas exploration & production in Texas, gold & silver exploration in Nevada & hotel & resort development in Mexico. Northern Minerals & Exploration Ltd. is an emerging an emerging publicly traded company focused on oil and gas exploration & production in Texas, gold & silver exploration in Nevada & hotel & resort development in Mexico.
CISCO, TX -- (Marketwired) -- 09/30/13 -- Northern Minerals & Exploration Ltd. (formerly Punchline Resources Ltd.) (OTCQB: NMEX) (OTCBB: NMEX) ("Northern Minerals" or the "Company") is pleased to...
| Period | Change | Change % | Open | High | Low | Avg. Daily Vol | VWAP | |
|---|---|---|---|---|---|---|---|---|
| 1 | 0.0544 | 44.8105436573 | 0.1214 | 0.1759 | 0.1214 | 4737 | 0.1759 | CS |
| 4 | -0.0142 | -7.47368421053 | 0.19 | 0.19 | 0.0867 | 6553 | 0.14775828 | CS |
| 12 | -0.0392 | -18.2325581395 | 0.215 | 0.2196 | 0.0867 | 5368 | 0.14293346 | CS |
| 26 | 0.0513 | 41.2048192771 | 0.1245 | 0.225 | 0.0719 | 5465 | 0.1507671 | CS |
| 52 | 0.1308 | 290.666666667 | 0.045 | 0.225 | 0.045 | 6494 | 0.14386888 | CS |
| 156 | 0.0458 | 35.2307692308 | 0.13 | 0.25 | 0.045 | 7796 | 0.11553951 | CS |
| 260 | 0.1078 | 158.529411765 | 0.068 | 0.35 | 0.02 | 17302 | 0.11470346 | CS |
| Symbol | Price | Vol. |
|---|---|---|
| AITXArtificial Intelligence Technology Solutions Inc (PK) | US$ 0.00275 (0.00%) | 51.06M |
| GTEHGenTech Holdings Inc (CE) | US$ 0.000001 (0.00%) | 48.25M |
| HMBLHUMBL Inc (PK) | US$ 0.0002 (-33.33%) | 42.65M |
| CBGLCannabis Global Inc (PK) | US$ 0.00015 (50.00%) | 41.81M |
| GTVHGolden Triangle Ventures Inc (PK) | US$ 0.0008 (33.33%) | 41.61M |
 threewheeler
3 years ago
threewheeler
3 years ago
 redsky7
5 years ago
redsky7
5 years ago
 Golden Cross
5 years ago
redsky7
5 years ago
Golden Cross
5 years ago
redsky7
5 years ago
 maddog 20/20
5 years ago
Miss Ferrari
5 years ago
maddog 20/20
5 years ago
Miss Ferrari
5 years ago
 Ronin_Trader
6 years ago
Ronin_Trader
6 years ago
maddog 20/20
6 years ago
Ronin_Trader
6 years ago
Ronin_Trader
6 years ago
Ronin_Trader
6 years ago
maddog 20/20
6 years ago
Ronin_Trader
6 years ago
maddog 20/20
6 years ago
Ronin_Trader
6 years ago
Ronin_Trader
6 years ago
maddog 20/20
6 years ago
maddog 20/20
6 years ago
Ronin_Trader
6 years ago
maddog 20/20
6 years ago
Ronin_Trader
6 years ago
Ronin_Trader
6 years ago
maddog 20/20
6 years ago
Ronin_Trader
6 years ago
Ronin_Trader
6 years ago
redsky7
6 years ago
Ronin_Trader
6 years ago
redsky7
6 years ago
Ronin_Trader
6 years ago
redsky7
6 years ago
Ronin_Trader
6 years ago
Miss Ferrari
6 years ago
maddog 20/20
6 years ago
Ronin_Trader
6 years ago
Ronin_Trader
6 years ago
Ronin_Trader
6 years ago
redsky7
6 years ago
Ronin_Trader
6 years ago
redsky7
6 years ago
Ronin_Trader
6 years ago
Miss Ferrari
6 years ago
maddog 20/20
6 years ago
Miss Ferrari
6 years ago
Ronin_Trader
6 years ago
redsky7
6 years ago
asrms1
6 years ago
AmadeusPotHead
6 years ago
Miss Ferrari
6 years ago
AmadeusPotHead
6 years ago
Ronin_Trader
6 years ago
Ronin_Trader
6 years ago
maddog 20/20
6 years ago
Ronin_Trader
6 years ago
Ronin_Trader
6 years ago
Ronin_Trader
6 years ago
maddog 20/20
6 years ago
Ronin_Trader
6 years ago
maddog 20/20
6 years ago
Ronin_Trader
6 years ago
Ronin_Trader
6 years ago
maddog 20/20
6 years ago
maddog 20/20
6 years ago
Ronin_Trader
6 years ago
maddog 20/20
6 years ago
Ronin_Trader
6 years ago
Ronin_Trader
6 years ago
maddog 20/20
6 years ago
Ronin_Trader
6 years ago
Ronin_Trader
6 years ago
redsky7
6 years ago
Ronin_Trader
6 years ago
redsky7
6 years ago
Ronin_Trader
6 years ago
redsky7
6 years ago
Ronin_Trader
6 years ago
Miss Ferrari
6 years ago
maddog 20/20
6 years ago
Ronin_Trader
6 years ago
Ronin_Trader
6 years ago
Ronin_Trader
6 years ago
redsky7
6 years ago
Ronin_Trader
6 years ago
redsky7
6 years ago
Ronin_Trader
6 years ago
Miss Ferrari
6 years ago
maddog 20/20
6 years ago
Miss Ferrari
6 years ago
Ronin_Trader
6 years ago
redsky7
6 years ago
asrms1
6 years ago
AmadeusPotHead
6 years ago
Miss Ferrari
6 years ago
AmadeusPotHead
6 years ago

It looks like you are not logged in. Click the button below to log in and keep track of your recent history.
Support: +44 (0) 203 8794 460 | support@advfn.com
By accessing the services available at ADVFN you are agreeing to be bound by ADVFN's Terms & Conditions

 Hot Features