Balance at 31
 December 2014               6,651     25,192      1,075       204    (30,510)         (211)     2,401
Consolidated Balance Sheet
at 31 December 2014
                                    Note      2014      2013
                                            GBP000    GBP000
ASSETS
Non-current assets
   Property, plant and equipment               187       165
   Goodwill                                    401       401
   Development costs                         1,103       640
   Deferred tax assets                         516       653

                                             2,207     1,859

Current assets
   Inventories                               1,439     1,779
   Trade and other receivables               2,982       983
   Cash and cash equivalents
    - escrow deposits                           54         -
   Cash and cash equivalents                 1,434     1,440

                                             5,909     4,202

Total assets                                 8,116     6,061

EQUITY AND LIABILITIES
Equity attributable to equity holders
 of the parent
   Share capital                       6     6,651     6,645
   Share premium                            25,192    25,153
   Equity reserve                              204       206
   Merger reserve                            1,075     1,075
   Currency translation reserve              (211)     (211)
   Retained earnings deficit              (30,510)  (31,132)

Total equity                                 2,401     1,736

Non-current liabilities
   Interest-bearing loans and
    borrowings                         5     1,524     1,518
   Deferred tax liabilities                    100       128

                                             1,624     1,646

Current liabilities
   Interest-bearing loans and                    -         -
    borrowings
   Other trade and other payables            4,091     2,679

                                             4,091     2,679

Total liabilities                            5,715     4,325

Total equity and liabilities                 8,116     6,061
Consolidated Statement of Cash Flows
for year ended 31 December 2014
                                         Note     2014     2013
                                                GBP000   GBP000
Cash flows from operating
 activities
Profit/(loss) for the year                         620  (2,293)
   Adjustments for:
   Depreciation                                     48       47
   Amortisation of intangible
    assets                                         198      261
   Financial income                         3      (3)     (20)
   Financial expense                        3      152    1,078
   Income tax credit                                 -     (95)
   Exchange differences                              -     (13)

Operating cash flows before
 movement in working capital                     1,015  (1,035)
   Change in trade and other
    receivables                                (2,035)      647
   Change in inventories                           340    (568)
   Change in trade and other
    payables                                     1,340    (267)

Cash generated from operations                     660  (1,223)
   Interest received                                 3       20
   Interest paid                                 (110)     (60)
   Tax received                                    208        -

Net cash from operating activities                 761  (1,263)

Cash flows from investing
 activities
   Acquisition of property,
    plant and equipment                           (70)     (40)
   Capitalised development expenditure           (661)    (371)
   Cash deposits held in escrow                   (54)       77

Net cash outflow from investing
 activities                                      (785)    (334)

Cash flows from financing
 activities
   Proceeds from exercise of
    share options                           6       18        -
   Proceeds from share issue                         -    1,150
   Expenses of share issue                           -     (87)
   Water Hall transaction                   3        -     (83)
   Proceeds from sale of own
    shares                                           -      595
   Repayment of bank borrowings                      -     (42)

Net cash inflow from financing
 activities                                         18    1,533

   Net decrease in cash and
    cash equivalents                               (6)     (64)
   Water Hall transaction: Settlement
    of working capital facility             3        -    1,551

   Total movement in cash and
    cash equivalents in the year                   (6)    1,487
   Cash and cash equivalents
    at 1 January                                 1,440     (47)

Cash and cash equivalents
 at 31 December                                  1,434    1,440


   1              Basis of preparation and status of financial information
The financial information set out in this statement has been
prepared in accordance with the recognition and measurement
principles of International Financial Reporting Standards as
adopted by the EU ("adopted IFRSs"), IFRIC interpretations and the
Companies Act 2006 applicable to companies reporting under IFRS. It
does not include all the information required for full annual
accounts.
The financial information does not constitute the Company's
statutory accounts for the years ended 31 December 2014 or 31
December 2013 but is derived from those accounts. Statutory
accounts for 2013 have been delivered to the registrar of
companies, and those for 2014 will be delivered in due course. The
auditor has reported on those accounts; his reports were (i)
unqualified, (ii) did not include a reference to any matters to
which the auditor drew attention by way of emphasis without
qualifying his report and (iii) did not contain a statement under
section 498 (2) or (3) of the Companies Act 2006.
2 Segmental information
The analysis by geographic segment below is presented in
accordance with IFRS 8 on the basis of those segments whose
operating results are regularly reviewed by the Board of Directors
(the Chief Operating Decision Maker as defined by IFRS 8) to make
strategic decisions, to monitor performance and to allocate
resources.
The directors consider the Group to have only one segment in
terms of products and services, being the development, supply and
maintenance of technologies used in advanced security, surveillance
and ruggedised electronic applications.
As the Board of Directors receives revenue, EBITDA and operating
profit/(loss) on the same basis as set out in the Consolidated
Income Statement no further reconciliation is considered to be
necessary.
As in 2013 the Group's operations continue to comprise one
segment.
Revenue by geographical destination can be analysed as
follows:
                                             2014             2013
                                           GBP000           GBP000

    United Kingdom                         10,773            5,482
    Continental Europe                      1,724              488
    Rest of World                             965              289
                                            _____            _____
                                           13,462            6,259
                                            _____            _____
Included in the above amounts are revenues of GBP9,793,000
(2013: GBP862,000) in respect of construction contracts. The
balance comprises revenue from sales of goods and services.
   3              Financial income and expense

                                              2014    2013
                                            GBP000  GBP000
Recognised in profit or loss
Interest on bank deposits                        3       -
Net foreign exchange gain                        -      20

Financial expenses                               3      20

                                            GBP000  GBP000

Interest expense on financial liabilities
 at amortised cost                             150     100
Net foreign exchange loss                        2       -
Water Hall transaction (see below)               -     978

Financial expenses                             152   1,078
On 29 August 2013 the Group completed a debt for equity swap
with Water Hall Group plc ('the Water Hall transaction'). Under the
terms of the arrangement, the Group issued equity share options,
and convertible loan notes with a combined fair value of
GBP2,975,000 to:
(i) settle its working capital facility of GBP1,551,000
(ii) purchase its own shares to the value of GBP592,000 and
(iii) acquire the remaining net assets of Water Hall Group plc
which comprised cash of GBP72,000 and net
liabilities of GBP68,000 relating to trade and other payables net of VAT receivables.
The loss on this transaction of GBP860,000 was included in total
exceptional finance costs for the year of GBP978,000; the balance
included transaction expenses of GBP118,000 (transaction expenses
totalled GBP155,000 of which GBP37,000 was allocated to merger
reserve). The net cash effect of the transaction was an outflow of
GBP83,000. In addition, the Group's overdraft of GBP1,551,000 was
settled. The debt for equity swap resulted in the Group obtaining
control of the Water Hall Group plc legal entity with the result
that, from 29 August 2013, Water Hall Group plc has been
consolidated into the accounts.
4 Taxation
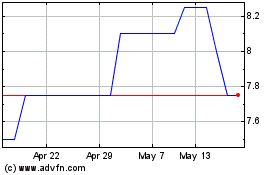
Petards (LSE:PEG)
Historical Stock Chart
From Jun 2024 to Jul 2024

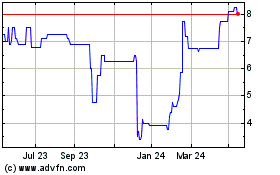
Petards (LSE:PEG)
Historical Stock Chart
From Jul 2023 to Jul 2024
