Bruker Corporation (NASDAQ: BRKR) today reported its financial
results for the three and nine months ended September 30, 2008. On
February 26, 2008, Bruker BioSciences Corporation closed its
acquisition of the Bruker BioSpin Group, and renamed itself Bruker
Corporation. Under US GAAP, this transaction is accounted for as an
acquisition of businesses under common control, and as a result all
one-time transaction costs are expensed in the period in which they
are incurred, rather than being added to goodwill. In addition,
expenses incurred subsequent to the consummation of the
acquisition, such as interest expenses incurred on acquisition
related debt, are not reflected in the financial results of periods
prior to the date of the acquisition, as they typically would be in
pro-forma financials in acquisitions of unrelated parties. After
the closing of the transaction all historical financial statements
are required to be restated by combining the historical
consolidated financial statements of Bruker BioSciences Corporation
with those of the Bruker BioSpin Group. Accordingly, the financial
results for the three and nine months ended September 30, 2008 and
2007, included within this release, represent the combined
historical consolidated financial statements of Bruker BioSciences
Corporation with those of the Bruker BioSpin Group. Financial
Results In the third quarter of 2008, revenue was $242.1 million,
compared to revenue of $241.8 million in the third quarter of 2007.
Excluding the effects of foreign currency translation, third
quarter 2008 revenue decreased by 7% year-over-year. Net income in
the third quarter of 2008 was $17.8 million, or $0.11 per diluted
share, compared to net income of $26.7 million, or $0.16 per
diluted share, in the third quarter of 2007. Included in GAAP EPS
in the third quarter of 2008 were non-cash stock-based compensation
expenses of $1.1 million, or ($0.01) per diluted share, compared to
non-cash stock-based compensation expenses of $0.5 million, or
($0.00) per diluted share, in the third quarter of 2007. For the
nine months ended September 30, 2008, revenue increased 15% to
$792.0 million, compared to revenue of $687.6 million during the
nine months ended September 30, 2007. Excluding the effects of
foreign currency translation, revenue for the nine months ended
September 30, 2008 increased by 6% year-over-year. Net income
during the nine months ended September 30, 2008 was $38.8 million,
or $0.23 per diluted share, compared to net income of $58.7
million, or $0.36 per diluted share, during the nine months ended
September 30, 2007. Included in GAAP EPS for the nine months ended
September 30, 2008 were Bruker BioSpin acquisition-related expenses
of ($0.04) per diluted share, interest expense on
acquisition-related debt of ($0.03) per diluted share, and non-cash
stock-based compensation expenses of ($0.02) per diluted share,
with a cumulative effect of ($0.08) per diluted share. For
comparison, included in net income for the nine months ended
September 30, 2007 were acquisition related charges of $0.5
million, or ($0.00) per diluted share, non-cash stock-based
compensation expenses of ($0.01) per diluted share, and there was
no acquisition-related interest expense, with a cumulative effect
of ($0.01) per diluted share. Frank Laukien, President and Chief
Executive Officer of Bruker Corporation, stated: �As expected,
while we have exceeded our annualized revenue growth goal so far in
2008, since our February 2008 merger we have experienced
significant quarterly revenue fluctuations. As in previous years,
we expect strong revenues in our fourth quarter of 2008, as our
bookings and backlog have remained healthy. During the first nine
months of 2008, our margins, adjusted for acquisition expenses,
have been below our goals. Therefore, in August 2008, we began to
take aggressive steps to reaccelerate our gross margin improvement
programs, to reduce operating and interest expenses, and to further
reduce our exposure to currency fluctuations, as well as to improve
our effective tax rate.� Dr. Laukien continued: �We expect that our
cost-cutting initiatives will already have noticeable positive
effects in the fourth quarter of 2008 and first quarter of 2009,
and that by the middle of 2009 we will see annualized reductions in
our overall costs of greater than $12 million. Moreover, we
anticipate that our recent significant new product roll-outs, major
product introductions planned within the next 12 months, and the
stronger U.S. dollar, all will contribute positively to our gross
margins in 2009 and 2010.� William Knight, Chief Financial Officer,
added: �We believe that despite the current economic uncertainty,
our diverse portfolio of products and solutions, our global
footprint, and our greater than 50% share of revenue derived from
universities, medical schools, non-profit research institutions and
government labs, position us well for being resilient in a
recession, and for continuing our positive long-term growth and
margin expansion trends. However, our year-to-date profitability is
below our expectations so we are actively pursuing productivity
initiatives that are expected to save the Company $12-15 million
annually, once fully effective. Implementation of these initiatives
is expected to result in one-time restructuring expenses and tax
charges of approximately $6 million.� USE OF NON-GAAP FINANCIAL
MEASURES In addition to the financial measures prepared in
accordance with generally accepted accounting principles (GAAP), we
use certain non-GAAP financial measures, including adjusted EPS.
Adjusted EPS excludes acquisition-related charges, interest expense
on acquisition-related debt, and foreign exchange gains and losses.
We believe the inclusion of these non-GAAP measures helps investors
to gain a better understanding of our core operating results and
future prospects, consistent with how management measures and
forecasts the Company�s performance, especially when comparing such
results to previous periods or forecasts. However, the non-GAAP
financial measures included in this press release are not meant to
be a better presentation or a substitute for results prepared in
accordance with GAAP. EARNINGS CONFERENCE CALL Bruker Corporation
will host an operator-assisted earnings conference call at 9 a.m.
Eastern Daylight Time on Thursday, October 30, 2008. To listen to
the webcast, investors can go to www.bruker.com and click on the
live web broadcast symbol. The webcast will be available through
the Company web site for 30 days. Investors can also listen and
participate on the telephone by calling 888-339-2688, or
+1-617-847-3007 outside the US and Canada. Investors should refer
to the Bruker Corporation Earnings Call. A telephone replay of the
conference call will be available one hour after the conference
call by dialing 888-286-8010, or +1-617-801-6888 outside the US and
Canada, and then entering replay pass code 32922679. CAUTIONARY
STATEMENT Any statements contained in this press release that do
not describe historical facts may constitute forward-looking
statements as that term is defined in the Private Securities
Litigation Reform Act of 1995. Any forward-looking statements
contained herein are based on current expectations, but are subject
to a number of risks and uncertainties. The factors that could
cause actual future results to differ materially from current
expectations include, but are not limited to, risks and
uncertainties relating to the integration of businesses we have
acquired or may acquire in the future, changing technologies,
product development and market acceptance of our products, the cost
and pricing of our products, manufacturing, competition, dependence
on collaborative partners and key suppliers, capital spending and
government funding policies, changes in governmental regulations,
intellectual property rights, litigation, and exposure to foreign
currency fluctuations. These and other factors are identified and
described in more detail in our filings with the SEC, including,
without limitation, our annual report on Form 10-K for the year
ended December 31, 2007, our most recent quarterly reports on Form
10-Q and our current reports on Form 8-K. We disclaim any intent or
obligation to update these forward-looking statements other than as
required by law. Bruker Corporation CONDENSED CONSOLIDATED
STATEMENTS OF OPERATIONS (in thousands, except per share data) � �
� � � Three Months Ended September 30, Nine Months Ended September
30, 2008 2007 2008 2007 � Product revenue $ 209,936 $ 215,838 $
695,820 $ 607,624 Service revenue 30,638 24,848 92,328 77,605 Other
revenue � 1,490 � � 1,074 � � 3,817 � � 2,409 � Total revenue
242,064 241,760 791,965 687,638 � Cost of product revenue 113,841
115,424 380,673 332,883 Cost of service revenue � 18,153 � � 15,228
� � 59,455 � � 49,184 � Total cost of revenue � 131,994 � � 130,652
� � 440,128 � � 382,067 � � Gross profit margin 110,070 111,108
351,837 305,571 � Operating Expenses: Sales and marketing 44,173
38,327 133,717 110,818 General and administrative 17,675 15,580
51,657 42,435 Research and development 33,089 26,841 100,808 80,462
Acquisition related charges � - � � 544 � � 6,153 � � 544 � Total
operating expenses � 94,937 � � 81,292 � � 292,335 � � 234,259 � �
Operating income 15,133 29,816 59,502 71,312 � Foreign exchange
gains (losses), net 3,177 (2,928 ) (5,864 ) (2,436 ) Interest and
other income (expense), net � (2,363 ) � 4,508 � � (1,984 ) � 6,980
� � Income before income tax provision and minority interest in
consolidated subsidiaries 15,947 31,396 51,654 75,856 Income tax
provision (benefit) � (1,966 ) � 4,616 � � 12,500 � � 16,923 � �
Income before minority interest in consolidated subsidiaries 17,913
26,780 39,154 58,933 Minority interest in consolidated subsidiaries
� 73 � � 109 � � 313 � � 255 � Net income $ 17,840 � $ 26,671 � $
38,841 � $ 58,678 � � Net income per share: Basic $ 0.11 � $ 0.16 �
$ 0.24 � $ 0.36 � Diluted $ 0.11 � $ 0.16 � $ 0.23 � $ 0.36 � �
Weighted average shares outstanding: Basic � 162,847 � � 161,922 �
� 162,531 � � 161,351 � Diluted � 165,918 � � 164,224 � � 165,606 �
� 164,029 � Bruker Corporation CONDENSED CONSOLIDATED BALANCE
SHEETS (in thousands) � � � � September 30, � December 31, 2008
2007 � ASSETS � Current assets: Cash and short-term investments $
87,367 $ 344,554 Accounts receivable, net 156,068 185,217
Inventories 456,814 447,688 Other current assets � 71,473 � 57,238
Total current assets 771,722 1,034,697 � Property and equipment,
net 219,317 207,588 Intangible and other assets � 86,471 � 69,346 �
Total assets $ 1,077,510 $ 1,311,631 � LIABILITIES AND
SHAREHOLDERS' EQUITY � Current liabilities: Short-term borrowings $
44,276 $ 35,591 Accounts payable 46,528 52,293 Customer deposits
201,084 233,466 Other current liabilities � 217,465 � 239,841 Total
current liabilities 509,353 561,191 � Long-term debt 169,703 8,605
Other long-term liabilities 103,274 105,445 Minority interest in
subsidiaries 810 538 � Total shareholders' equity � 294,370 �
635,852 � Total liabilities and shareholders' equity $ 1,077,510 $
1,311,631
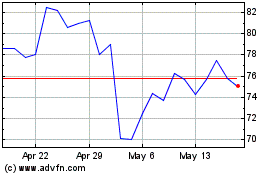
Bruker (NASDAQ:BRKR)
Historical Stock Chart
From Jun 2024 to Jul 2024

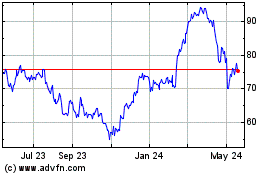
Bruker (NASDAQ:BRKR)
Historical Stock Chart
From Jul 2023 to Jul 2024
