
Investor Presentation MoneyHero Group September 2023 Filed by MoneyHero Limited Pursuant to Rule 425 under the Securities Act of
1933, as amended, and deemed filed pursuant to Rule 14a-12 under the Securities Exchange Act of 1934, as amended Subject Company: Bridgetown Holdings Limited Commission File
No. 001-39623

Empowering and connecting people to a better financial future

MoneyHero Group connects people to a better financial future Our mission at MoneyHero Group is to make all of life’s financial
decisions a time saving and rewarding experience We educate people about personal finance, help them decide which products are best suited for their needs, and facilitate getting the product We connect financial institutions with their target
customers and help them achieve their customer acquisition objectives
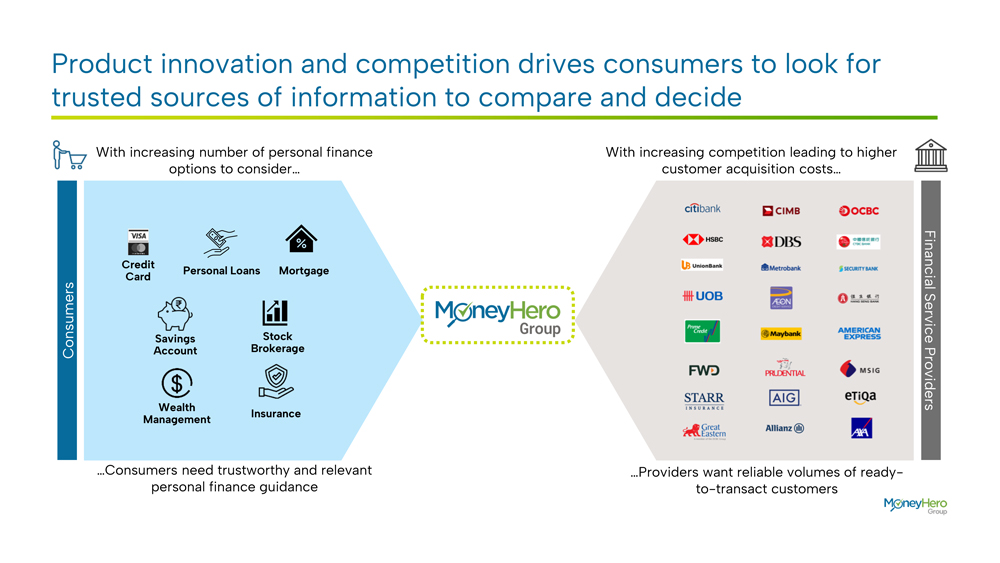
Product innovation and competition drives consumers to look for trusted sources of information to compare and decide Consumers Financial
Service Providers …Consumers need trustworthy and relevant personal finance guidance …Providers want reliable volumes of ready-to-transact customers With
increasing number of personal finance options to consider… With increasing competition leading to higher customer acquisition costs… Wealth Management Credit Card Insurance Personal Loans Stock Brokerage Savings Account Mortgage
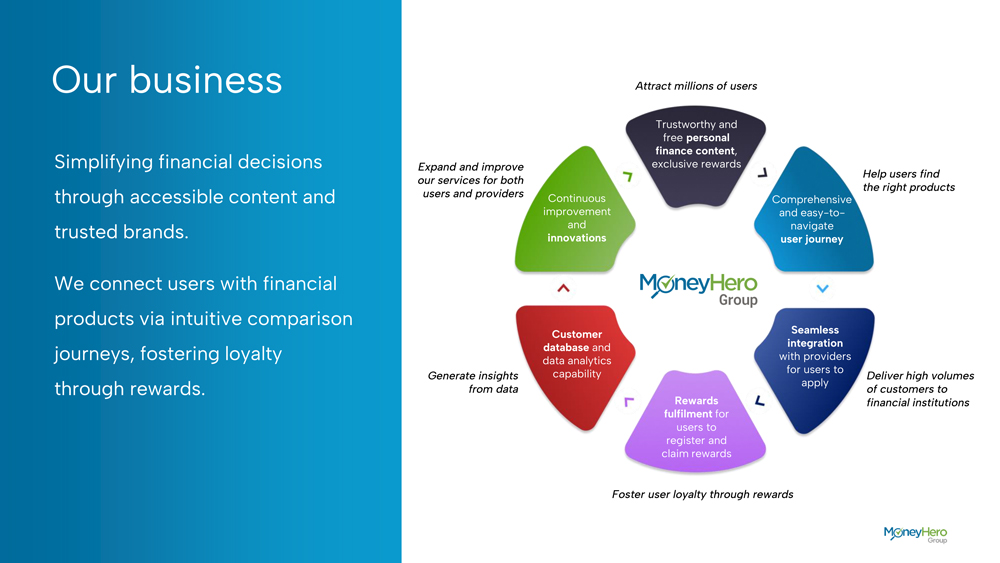
Our business Simplifying financial decisions through accessible content and trusted brands. We connect users with financial products via
intuitive comparison journeys, fostering loyalty through rewards. Trustworthy and free personal finance content, exclusive rewards Comprehensive and easy-to-navigate
user journey Rewards fulfilment for users to register and claim rewards Seamless integration with providers for users to apply Continuous improvement and innovations Customer database and data analytics capability Attract millions of users Help
users find the right products Deliver high volumes of customers to financial institutions Foster user loyalty through rewards Generate insights from data Expand and improve our services for both users and providers
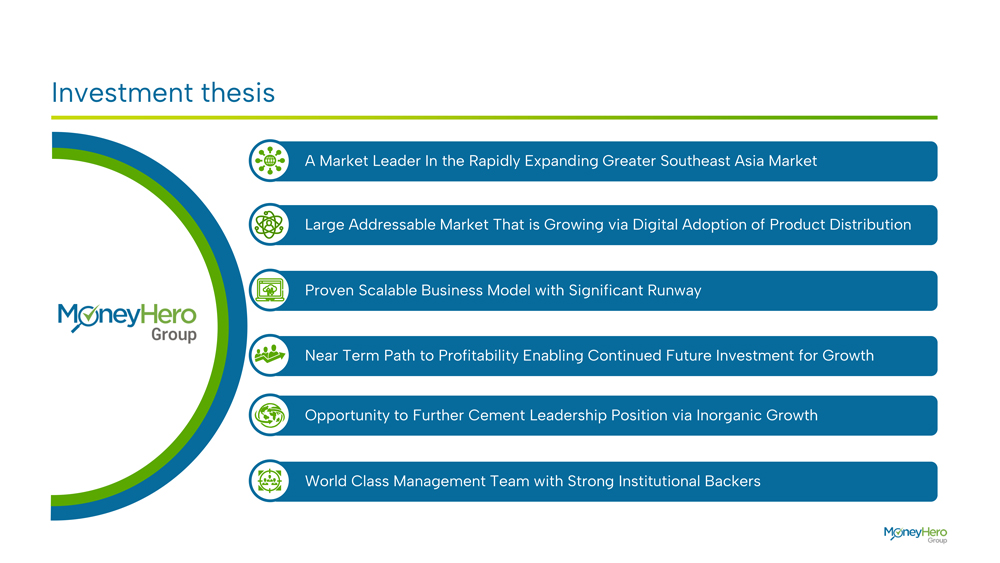
Investment thesis A Market Leader In the Rapidly Expanding Greater Southeast Asia Market Proven Scalable Business Model with Significant
Runway World Class Management Team with Strong Institutional Backers Large Addressable Market That is Growing via Digital Adoption of Product Distribution Near Term Path to Profitability Enabling Continued Future Investment for Growth
Opportunity to Further Cement Leadership Position via Inorganic Growth
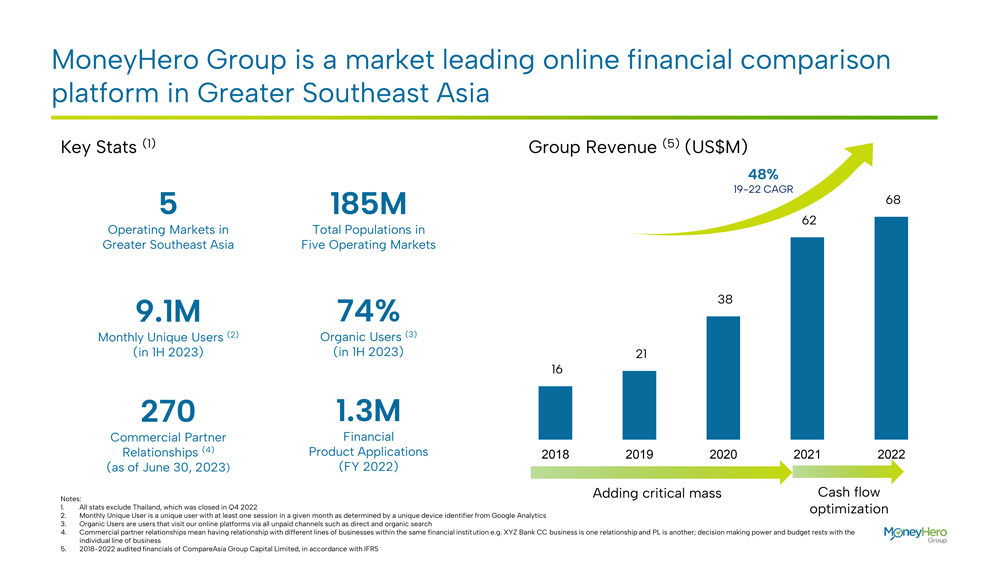
16 21 38 62 68 2018 2019 2020 2021 2022 MoneyHero Group is a market leading online financial comparison platform in Greater Southeast
Asia 5Operating Markets in Greater Southeast Asia 185MTotal Populations in Five Operating Markets 74%Organic Users (3) (in 1H 2023) 270Commercial Partner Relationships (4) (as of June 30, 2023) 1.3MFinancial Product Applications (FY 2022)
9.1MMonthly Unique Users (2) (in 1H 2023) Notes: All stats exclude Thailand, which was closed in Q4 2022 Monthly Unique User is a unique user with at least one session in a givenmonth as determined by a unique device identifier from Google Analytics
Organic Users are users that visit our online platforms via all unpaid channels such as direct and organic search Commercial partner relationships mean having relationship with different lines of businesses within the same financial institution
e.g.XYZ Bank CC business is one relationship and PL is another; decision making power and budget rests with the individual line of business 2018-2022 audited financials of CompareAsiaGroup Capital Limited, in accordance with IFRS Group Revenue
(5)(US$M) Key Stats (1) 48% 19-22 CAGR Adding critical mass Cash flow optimization
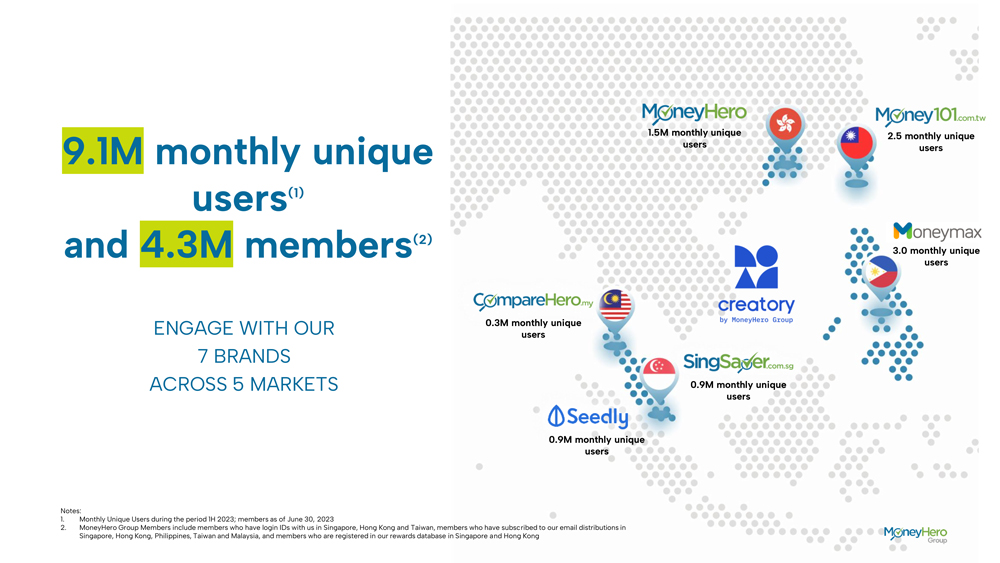
1.5M monthly unique 2.5 monthly unique 9.1M monthly unique users users users(1) and 4.3M members(2) 3.0 monthly unique users ENGAGE WITH
OUR 0.3M monthly unique users 7 BRANDS ACROSS 5 MARKETS 0.9M monthly unique users 0.9M monthly unique users Notes: 1. Monthly Unique Users during the period 1H 2023; members as of June 30, 2023 2. MoneyHero Group Members include members who have
login IDs with us in Singapore, Hong Kong and Taiwan, members who have subscribed to our email distributions in Singapore, Hong Kong, Philippines, Taiwan and Malaysia, and members who are registered in our rewards database in Singapore and Hong Kong
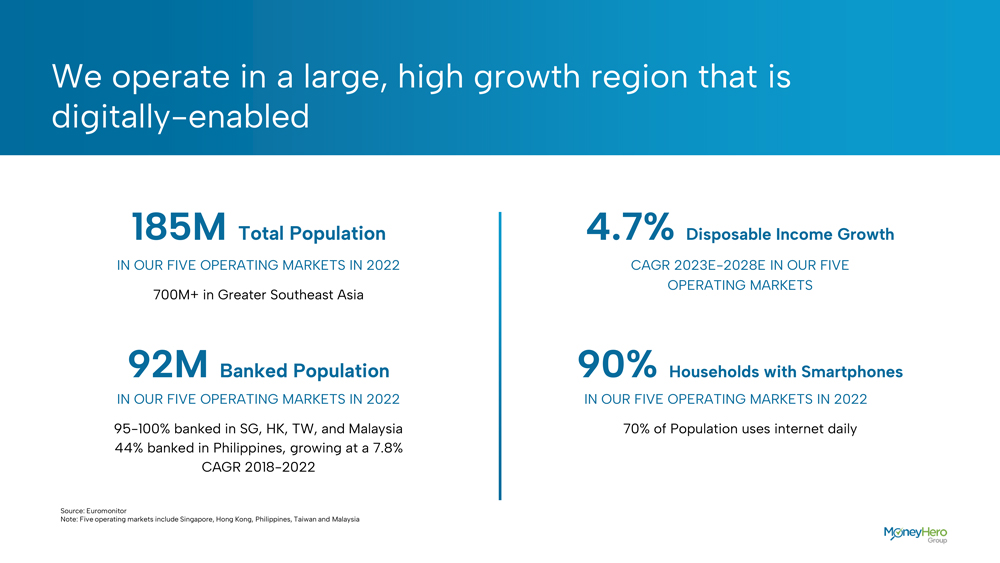
We operate in a large, high growth region that is digitally-enabled 185M Total Population 4.7% Disposable Income Growth IN OUR FIVE
OPERATING MARKETS IN 2022 CAGR 2023E-2028E IN OUR FIVE 700M+ in Greater Southeast Asia OPERATING MARKETS 92M Banked Population 90% Households with Smartphones IN OUR FIVE OPERATING MARKETS IN 2022 IN OUR FIVE OPERATING MARKETS IN 2022 95-100% banked
in SG, HK, TW, and Malaysia 70% of Population uses internet daily 44% banked in Philippines, growing at a 7.8% CAGR 2018-2022 Source: Euromonitor Note: Five operating markets include Singapore, Hong Kong, Philippines, Taiwan and Malaysia
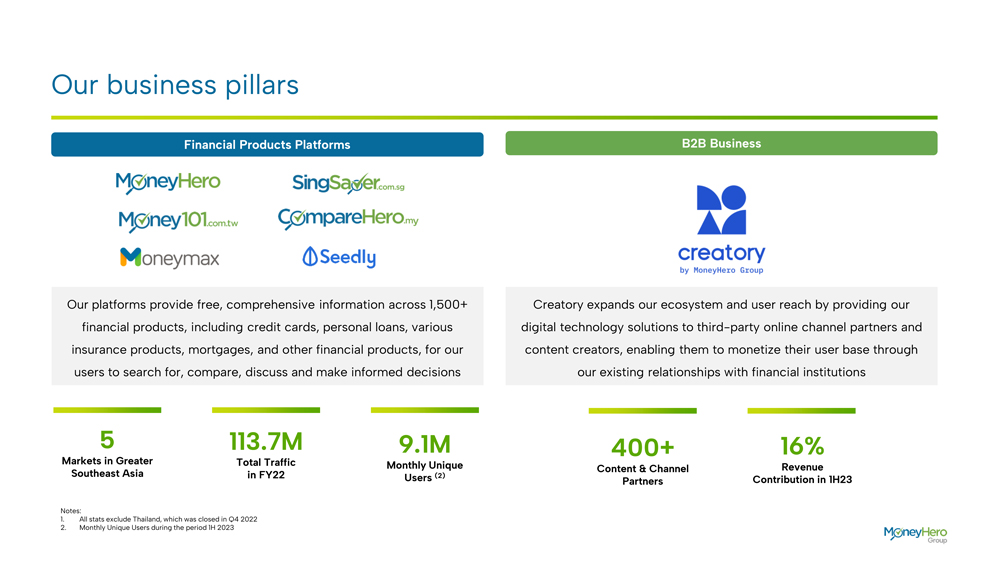
Our business pillars Notes: All stats exclude Thailand, which was closed in Q4 2022 Monthly Unique Users during the period 1H 2023
Financial Products Platforms B2B Business Our platforms provide free, comprehensive information across 1,500+ financial products, including credit cards, personal loans, various insurance products, mortgages, and other financial products, for our
users to search for, compare, discuss and make informed decisions Creatory expands our ecosystem and user reach by providing our digital technology solutions to third-party online channel partners and content creators, enabling them to monetize
their user base through our existing relationships with financial institutions 113.7MTotal Traffic in FY22 5Markets in Greater Southeast Asia 9.1MMonthly Unique Users (2) 400+Content & Channel Partners 16%Revenue Contribution in 1H23
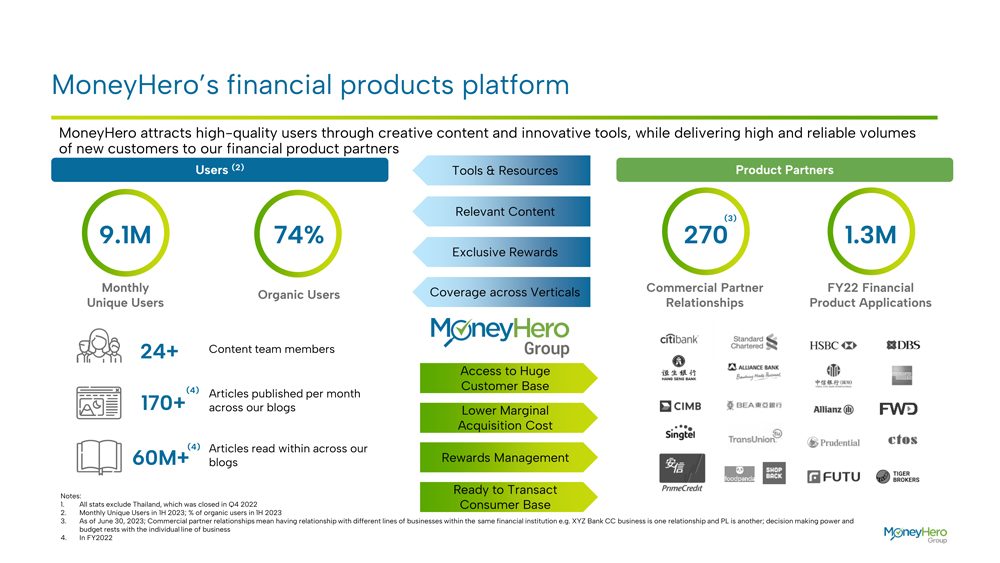
MoneyHero’s financial products platform Notes: All stats exclude Thailand, which was closed in Q4 2022 Monthly Unique Users in 1H
2023; % of organic users in 1H 2023 As of June 30, 2023; Commercial partner relationships mean having relationship with different lines of businesses within the same financial institution e.g.XYZ Bank CC business is one relationship and PL is
another; decision making power and budget rests with the individual line of business In FY2022 Tools & Resources Relevant Content Exclusive Rewards Access to Huge Customer Base Lower Marginal Acquisition Cost Rewards Management 270
Commercial Partner Relationships 1.3M Content team members 24+ Articles published per month across our blogs 170+ 60M+ Articles read within across our blogs 9.1M Monthly Unique Users 74% Organic Users Coverage across Verticals Ready to Transact
Consumer Base (4) FY22 Financial Product Applications MoneyHero attracts high-quality users through creative content and innovative tools, while delivering high and reliable volumes of new customers to our financial product partners Users
(2) Product Partners (4) (3)
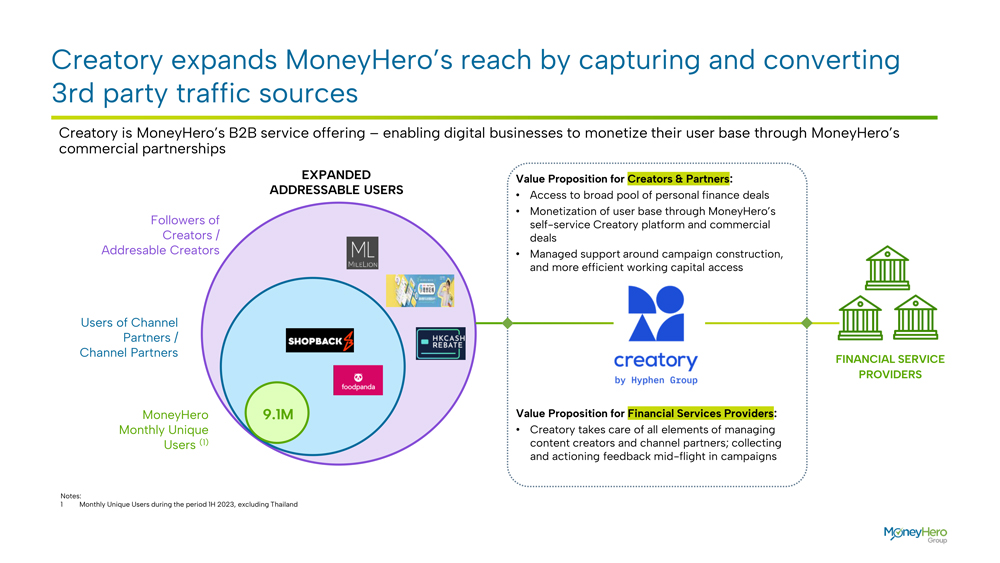
Creatoryexpands MoneyHero’s reach by capturing and converting 3rd party traffic sources Notes: Monthly Unique Users during the
period 1H 2023, excluding Thailand Creatory is MoneyHero’s B2B service offering –enabling digital businesses to monetize their user base through MoneyHero’s commercial partnerships Value Proposition for Creators & Partners:
Access to broad pool of personal finance deals Monetization of user base through MoneyHero’s self-service Creatory platform and commercial deals Managed support around campaign construction, and more efficient working capital access Value
Proposition for Financial Services Providers: Creatory takes care of all elements of managing content creators and channel partners; collecting and actioning feedback mid-flight in campaigns 9.1M
MoneyHeroMonthly Unique Users (1) Users of Channel Partners / Channel Partners Followers of Creators / Addresable Creators EXPANDED ADDRESSABLE USERS FINANCIAL SERVICE PROVIDERS
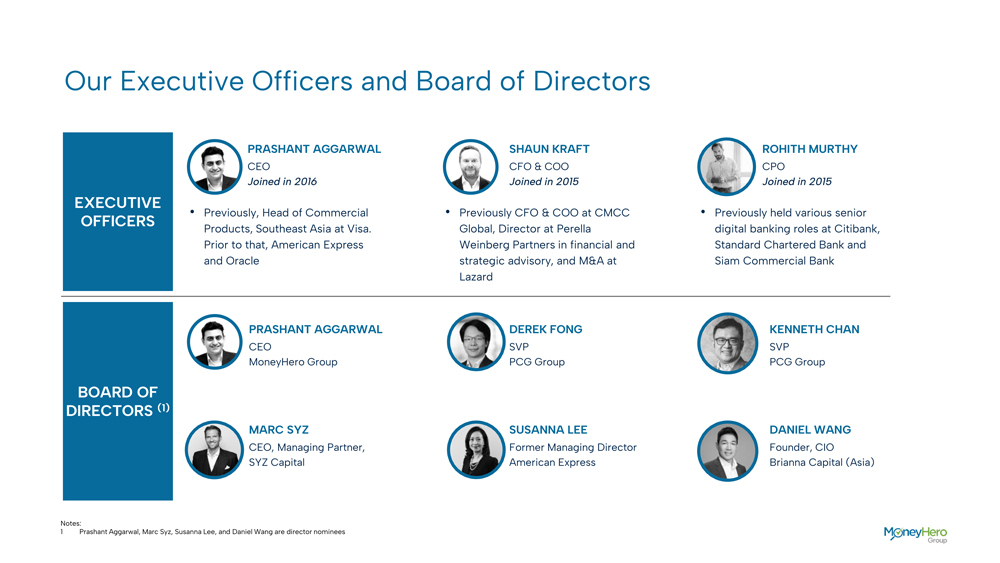
Our Executive Officers and Board of Directors PRASHANT AGGARWAL SHAUN KRAFT ROHITH MURTHY CEO CFO & COO CPO Joined in 2016
Joined in 2015 Joined in 2015 EXECUTIVE • Previously, Head of Commercial • Previously CFO & COO at CMCC • Previously held various senior OFFICERS Products, Southeast Asia at Visa. Global, Director at Perella digital banking
roles at Citibank, Prior to that, American Express Weinberg Partners in financial and Standard Chartered Bank and and Oracle strategic advisory, and M&A at Siam Commercial Bank Lazard PRASHANT AGGARWAL DEREK FONG KENNETH CHAN CEO SVP SVP
MoneyHero Group PCG Group PCG Group BOARD OF DIRECTORS (1) MARC SYZ SUSANNA LEE DANIEL WANG CEO, Managing Partner, Former Managing Director Founder, CIO SYZ Capital American Express Brianna Capital (Asia) Notes: 1 Prashant Aggarwal, Marc Syz,
Susanna Lee, and Daniel Wang are director nominees Notes: Prashant Aggarwal, Marc Syz, Susanna Lee, and Daniel Wang are director nominees

Our Group Leadership Team PROFESSIONAL EXPERIENCE OF TEAM TOMKAPELLER Group Head of Insurance KAMEELVIJ Group Head of People and Talent
LAURAHANNON General Counsel KATELEE Group Head of Strategic Finance NAWAZIMAM Group Head of Strategy SHRAVANTHAKUR Group Co-Head of Commercial SANDEEPKRISHNAMANI Group
Co-Head of Commercial RUBYCHOU Group Head of Marketing IVANHO Group Finance Director MIRIAMFRANKLIN Portfolio Director SPENCERLEUNG Investor Relations and Strategic Advisor JAGMALSINGH Technology Advisor

Financials (MoneyHero Group Standalone)
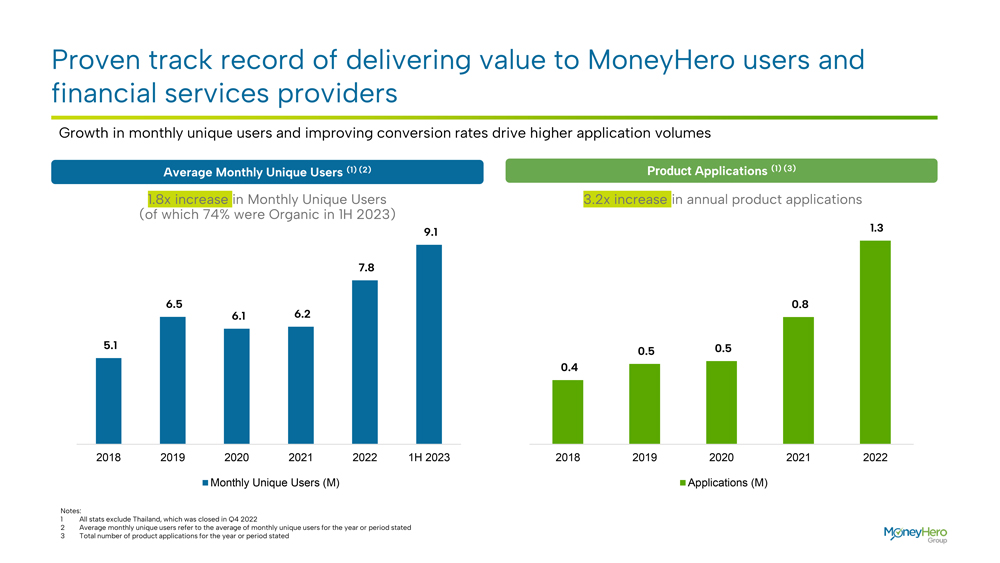
Proven track record of delivering value to MoneyHero users and financial services providers Notes: All stats exclude Thailand, which was
closed in Q4 2022 Average monthly unique users refer to the average of monthly unique users for the year or period stated Total number of product applications for the year or period stated Average Monthly Unique Users (1) (2) Product Applications(1)
(3) Growth in monthly unique users and improving conversion rates drive higher application volumes 1.8x increase in Monthly Unique Users (of which 74% were Organic in 1H 2023) 3.2x increase in annual product applications 5.1 6.5 6.1 6.2 7.8 9.1 2018
2019 2020 2021 2022 1H 2023 Monthly Unique Users (M) 0.4 0.5 0.5 0.8 1.3 2018 2019 2020 2021 2022 Applications (M)
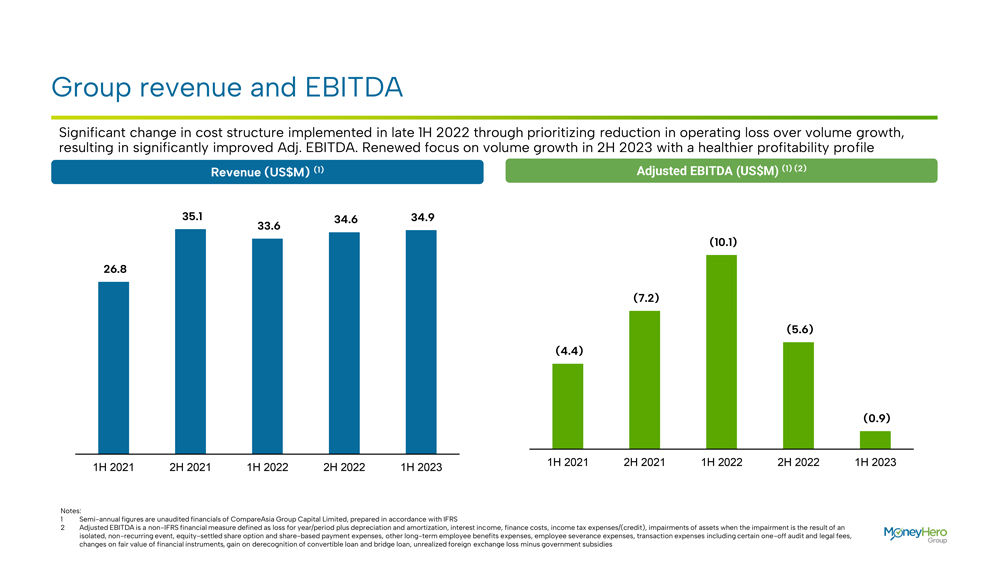
Group revenue and EBITDA Notes: Semi-annual figures are unaudited financials of CompareAsiaGroup Capital Limited,prepared in accordance
with IFRS Adjusted EBITDA is a non-IFRS financial measure defined as loss for year/period plus depreciation and amortization, interest income, finance costs, income tax expenses/(credit), impairments of assets
when the impairment is the result of an isolated, non-recurring event, equity-settled share option and share-based payment expenses, other long-term employee benefits expenses, employee severance expenses,
transaction expenses including certain one-off audit and legal fees, changes on fair value of financial instruments, gain on derecognition of convertible loan and bridge loan, unrealized foreignexchange loss
minus government subsidies Revenue (US$M) (1) Adjusted EBITDA (US$M) (1) (2) Significant change in cost structure implemented in late 1H 2022 through prioritizing reduction in operating loss over volumegrowth, resulting in significantly
improved Adj. EBITDA. Renewed focus on volume growth in 2H 2023 with a healthier profitability profile 26.8 35.1 33.6 34.6 34.9 1H 2021 2H 2021 1H 2022 2H 2022 1H 2023 (4.4) (7.2) (10.1) (5.6) (0.9) 1H 2021 2H 2021 1H 2022 2H 2022 1H 2023
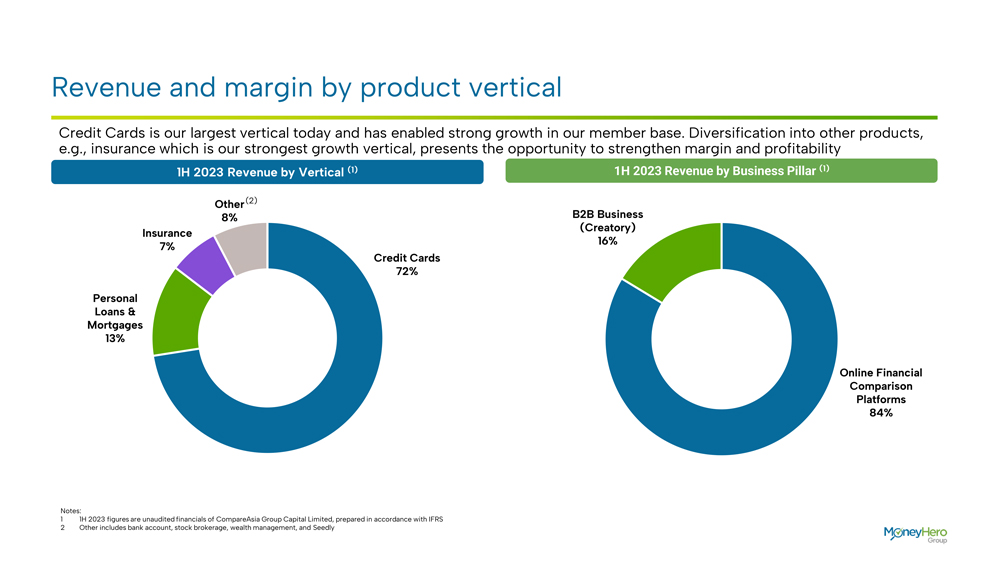
Revenue and margin by product vertical Notes: 1H 2023 figures are unaudited financials of CompareAsiaGroup Capital Limited, prepared in
accordance with IFRS Other includes bank account, stock brokerage, wealth management, and Seedly 1H2023 Revenue by Vertical (1) 1H2023 Revenue by Business Pillar (1) Credit Cards is our largest vertical today and has enabled strong growth in
our member base. Diversification into other products, e.g., insurance which is our strongest growth vertical, presents the opportunity to strengthen margin and profitability (2)Credit Cards 72% Personal Loans & Mortgages 13% Insurance 7%
Other 8% Online Financial Comparison Platforms 84% B2B Business (Creatory) 16%
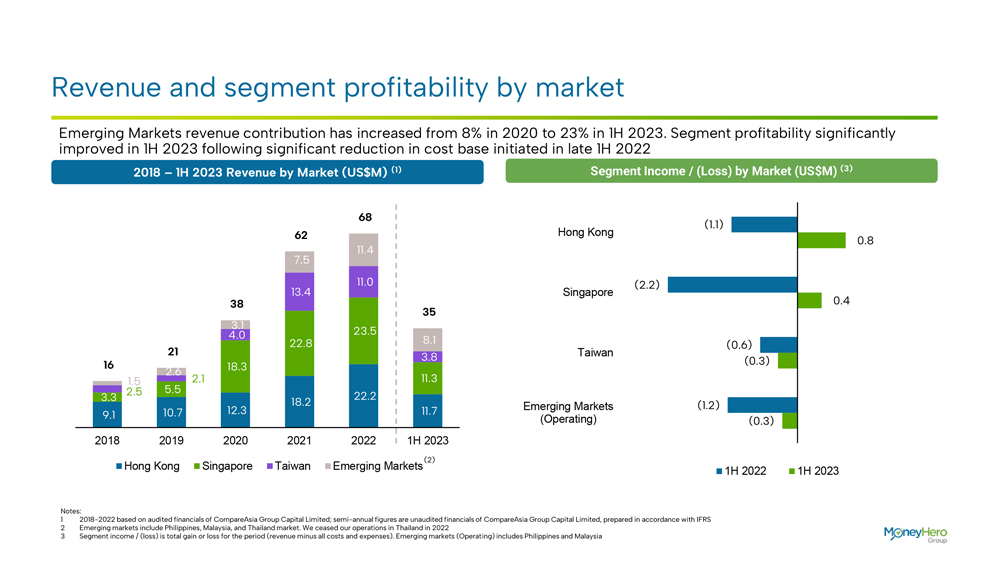
Revenue and segment profitability by market Emerging Markets revenue contribution has increased from 8% in 2020 to 23% in 1H 2023.
Segment profitability significantly improved in 1H 2023 following significant reduction in cost base initiated in late 1H 2022 2018 – 1H 2023 Revenue by Market (US$M) (1) Segment Income / (Loss) by Market (US$M) (3) 68 (1.1) 62 Hong Kong 0.8
7.5 11.4 13.4 11.0 (2.2) Singapore 38 0.4 35 3.1 4.0 23.5 22.8 8.1 (0.6) 21 3.8 Taiwan 16 (0.3) 2.6 18.3 1.5 5.5 2.1 11.3 2.5 22.2 3.3 18.2 12.3 Emerging Markets (1.2) 9.1 10.7 11.7 (Operating) (0.3) 2018 2019 2020 2021 2022 1H 2023 (2) Hong Kong
Singapore Taiwan Emerging Markets 1H 2022 1H 2023 Notes: 1 2018-2022 based on audited financials of CompareAsia Group Capital Limited; semi-annual figures are unaudited financials of CompareAsia Group Capital Limited, prepared in accordance with
IFRS 2 Emerging markets include Philippines, Malaysia, and Thailand market. We ceased our operations in Thailand in 2022 3 Segment income / (loss) is total gain or loss for the period (revenue minus all costs and expenses). Emerging markets
(Operating) includes Philippines and Malaysia 19
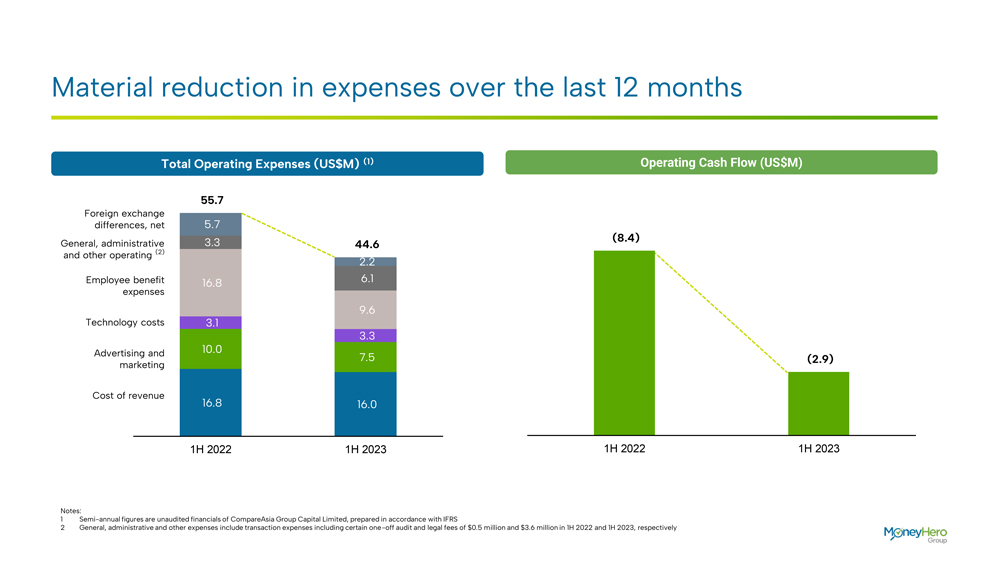
16.8 16.0 10.0 7.5 3.1 3.3 16.8 9.6 3.3 6.1 5.7 2.2 55.7 44.6 1H 2022 1H 2023 Material reduction in expenses over the last 12
months Notes: Semi-annual figures are unaudited financials of CompareAsiaGroup Capital Limited, prepared in accordance with IFRS General, administrative and other expenses include transaction expenses including certain
one-off audit and legal fees of $0.5 million and $3.6 million in 1H 2022 and 1H 2023, respectively Total Operating Expenses (US$M) (1) Operating Cash Flow (US$M)Foreign exchange differences, net
General, administrative and other operating (2) Employee benefit expenses Technology costs Advertising and marketing Cost of revenue
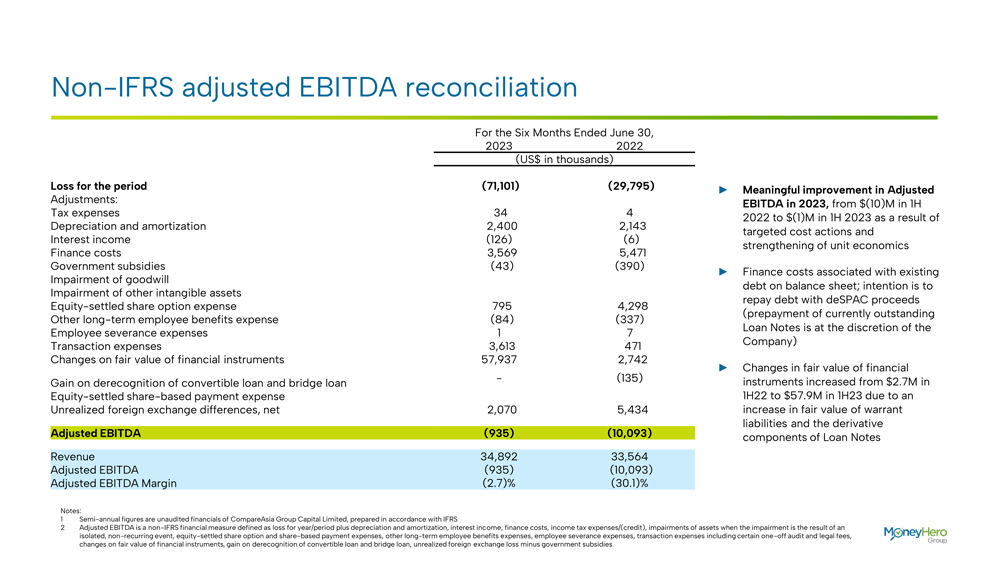
Non-IFRS adjusted EBITDA reconciliation For the Six Months Ended June 30, 20232022 (US$ in
thousands) Loss for the period(71,101)(29,795)â–º Meaningful improvement in Adjusted Adjustments:EBITDA in 2023, from $(10)M in 1H Tax expenses3442022 to $(1)M in 1H 2023 as a result of Depreciation and amortization2,4002,143targeted
cost actions and Interest income(126)(6)strengthening of unit economics Finance costs3,5695,471 Government subsidies(43)(390)â–º Finance costs associated with existing Impairment of goodwilldebt on balance sheet; intention is to
Impairment of other intangible assets Equity-settled share option expense7954,298repay debt with deSPAC proceeds Other long-term employee benefits expense (84)(337)(prepayment of currently outstanding Employee severance expenses17Loan Notes is at
the discretion of the Transaction expenses3,613471Company) Changes on fair value of financial instruments57,9372,742 â–º Changes in fair value of financial Gain on derecognition of convertible loan and bridge loan -(135)instruments
increased from $2.7M in Equity-settled share-based payment expense1H22 to $57.9M in 1H23 due to an Unrealized foreign exchange differences, net2,0705,434increase in fair value of warrant liabilities and the derivative Adjusted
EBITDA(935)(10,093)components of Loan Notes Revenue34,89233,564 Adjusted EBITDA(935)(10,093) Adjusted EBITDA Margin(2.7)%(30.1)% Notes: 1Semi-annual figures are unaudited financials of CompareAsia Group Capital Limited, prepared in accordance with
IFRS 2Adjusted EBITDA is a non-IFRS financial measure defined as loss for year/period plus depreciation and amortization, interest income, finance costs, income tax expenses/(credit), impairments of assets
when the impairment is the result of an isolated, non-recurring event, equity-settled share option and share-based payment expenses, other long-term employee benefits expenses, employee severance expenses,
transaction expenses including certain one-off audit and legal fees, changes on fair value of financial instruments, gain on derecognition of convertible loan and bridge loan, unrealized foreign exchange loss
minus government subsidies

Appendix
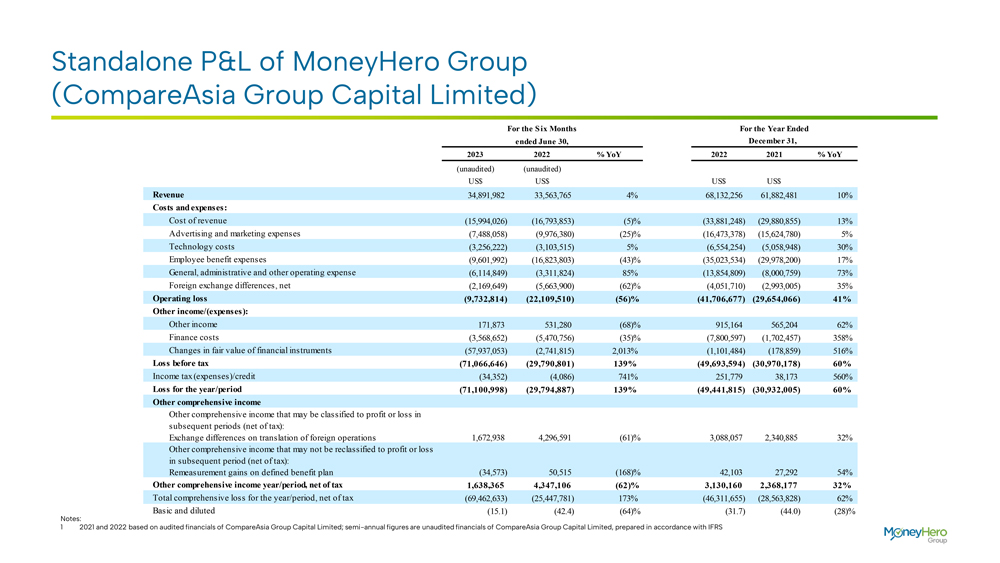
Standalone P&L of MoneyHero Group (CompareAsiaGroup Capital Limited) Notes: 2021 and 2022 based on audited financials of
CompareAsiaGroup Capital Limited; semi-annual figures are unaudited financials of CompareAsiaGroup Capital Limited, prepared in accordance with IFRS December 31,20232022% YoY20222021% YoY(unaudited)(unaudited)US$US$US$US$Revenue34,891,982
33,563,765 4% 68,132,256 61,882,481 10% Costs and expenses:Cost of revenue(15,994,026) (16,793,853) (5)% (33,881,248) (29,880,855) 13% Advertising and marketing expenses(7,488,058) (9,976,380) (25)% (16,473,378) (15,624,780) 5% Technology
costs(3,256,222) (3,103,515) 5% (6,554,254) (5,058,948) 30% Employee benefit expenses(9,601,992) (16,823,803) (43)% (35,023,534) (29,978,200) 17% General, administrative and other operating expense(6,114,849) (3,311,824) 85% (13,854,809) (8,000,759)
73% Foreign exchange differences, net(2,169,649) (5,663,900) (62)% (4,051,710) (2,993,005) 35% Operating loss(9,732,814) (22,109,510) (56)% (41,706,677) (29,654,066) 41% Other income/(expenses):Other income171,873 531,280 (68)% 915,164 565,204 62%
Finance costs(3,568,652) (5,470,756) (35)% (7,800,597) (1,702,457) 358% Changes in fair value of financial instruments(57,937,053) (2,741,815) 2,013% (1,101,484) (178,859) 516% Loss before tax(71,066,646) (29,790,801) 139% (49,693,594) (30,970,178)
60% Income tax (expenses)/credit(34,352) (4,086) 741% 251,779 38,173 560% Loss for the year/period(71,100,998) (29,794,887) 139% (49,441,815) (30,932,005) 60% Other comprehensive incomeOther comprehensive income that may be classified to profit or
loss in subsequent periods (net of tax):Exchange differences on translation of foreign operations1,672,938 4,296,591 (61)% 3,088,057 2,340,885 32% Other comprehensive income that may not be reclassified to profit or loss in subsequent period (net of
tax): Remeasurement gains on defined benefit plan(34,573) 50,515 (168)% 42,103 27,292 54% Other comprehensive income year/period, net of tax1,638,365 4,347,106 (62)% 3,130,160 2,368,177 32% Total comprehensive loss for the year/period, net of
tax(69,462,633) (25,447,781) 173% (46,311,655) (28,563,828) 62% Basic and diluted(15.1) (42.4) (64)% (31.7) (44.0) (28)% ended June 30,For the Six MonthsFor the Year Ended
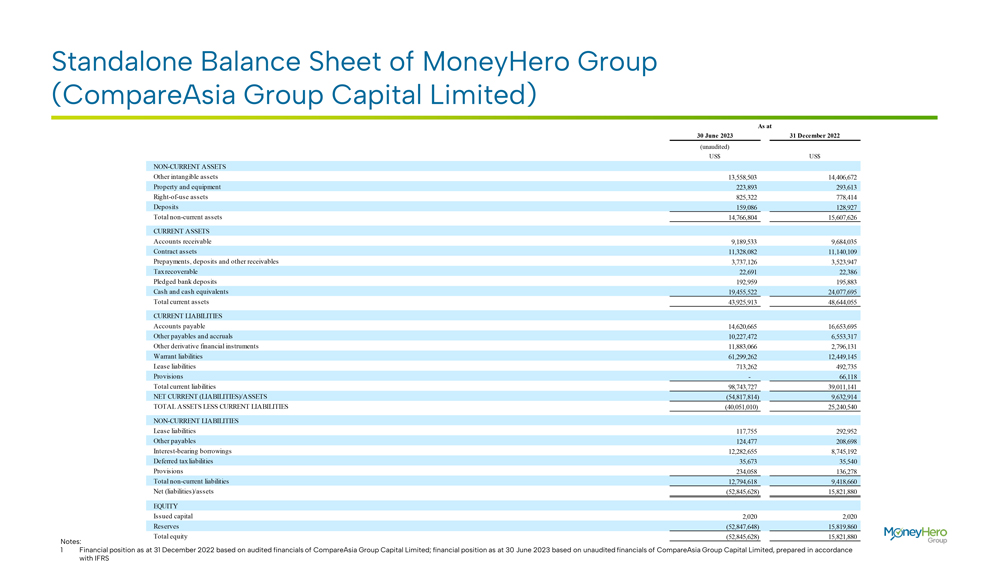
Standalone Balance Sheet of MoneyHero Group (CompareAsia Group Capital Limited) 30 June 2023 31 December 2022 (unaudited) US$
US$ NON-CURRENT ASSETS Other intangible assets 13,558,503 14,406,672 Property and equipment 223,893 293,613 Right-of-use assets
825,322 778,414 Deposits 159,086 128,927 Total non-current assets 14,766,804 15,607,626 CURRENT ASSETS Accounts receivable 9,189,533 9,684,035 Contract assets 11,328,082 11,140,109 Prepayments, deposits and
other receivables 3,737,126 3,523,947 Tax recoverable 22,691 22,386 Pledged bank deposits 192,959 195,883 Cash and cash equivalents 19,455,522 24,077,695 Total current assets 43,925,913 48,644,055 CURRENT LIABILITIES Accounts payable 14,620,665
16,653,695 Other payables and accruals 10,227,472 6,553,317 Other derivative financial instruments 11,883,066 2,796,131 Warrant liabilities 61,299,262 12,449,145 Lease liabilities 713,262 492,735 Provisions—66,118 Total current liabilities
98,743,727 39,011,141 NET CURRENT (LIABILITIES)/ASSETS (54,817,814) 9,632,914 TOTAL ASSETS LESS CURRENT LIABILITIES (40,051,010) 25,240,540 NON-CURRENT LIABILITIES Lease liabilities 117,755 292,952 Other
payables 124,477 208,698 Interest-bearing borrowings 12,282,655 8,745,192 Deferred tax liabilities 35,673 35,540 Provisions 234,058 136,278 Total non-current liabilities 12,794,618 9,418,660 Net
(liabilities)/assets (52,845,628) 15,821,880 EQUITY Issued capital 2,020 2,020 Reserves (52,847,648) 15,819,860 Total equity (52,845,628) 15,821,880 As at Notes: Financial position as at 31 December 2022 based on audited financials of
CompareAsia Group Capital Limited; financial position as at 30 June 2023 based on unaudited financials of CompareAsia Group Capital Limited, prepared in accordance with IFRS

Forward-Looking Statements This communication includes “forward-looking statements” within the meaning of the United States
federal securities laws with respect to the proposed business combination between CompareAsiaGroup Capital Limited (“the Company”), and Bridgetown Holdings Limited (“Bridgetown”) (the “Business Combination”) and
alsocontains certain financial forecasts and projections. All statements other than statements of historical fact contained in thiscommunication, including, but not limited to, statements as to future results of operations and financial position,
objectives of management for future operations of the Company, market size and growth opportunities, are forward-looking statements. Some of these forward-looking statements can be identified by the use offorward-looking words, including
“outlook,” “believes,” “expects,” “potential,” “continues,” “may,” “will,” “should,” “could,” “seeks,” “predicts,” “intends,”
“trends,” “plans,” “estimates,” “anticipates” or the negative version of these words or other comparable words. All forward-looking statements are based upon estimates and forecasts and reflect the views,
assumptions, expectations, and opinions of Bridgetown and the Company, which are all subject to change due to various factorsincluding, without limitation, changes in general economic conditions. Any such estimates, assumptions, expectations,
forecasts, views or opinions, whether or notidentified in this communication, should be regarded as indicative, preliminary and for illustrative purposes only and shouldnot be relied upon as being necessarily indicative of future results. The
forward-looking statements and financial forecasts and projections contained in this communication are subject to a number offactors, risks and uncertainties. Potential risks and uncertainties that could cause the actual results to differ materially
from those expressed or implied by forward-looking statements include, but are not limited to, changes in business, market, financial, political and legal conditions; the timing and structure of the Business Combination; changes to the proposed
structure of the Business Combination that may be required or appropriate as a result ofapplicable laws or regulations; the inability of the parties to successfully or timely consummate the Business Combination and the other transactions in
connection therewith, including as a result of the risk that any regulatory approvals are not obtained, are delayed or are subject to unanticipated conditions that could adversely affect the combined company or the expected benefits of the Business
Combination or that the approval of the shareholders of Bridgetown or the Company is not obtained; the risk that the Business Combination disrupts current plans and operations of Bridgetown or the Company as a result of the announcement and
consummation of the Business Combination; PubCo’sinability to obtain or maintain the listing of its securities on Nasdaq following the Business Combination; failure to realize the anticipated benefits of Business Combination; risk relating to
the uncertainty of the projected financial information with respect to the Company; the amount of redemption requests made by Bridgetown’s shareholders and the amount of funds available in Bridgetown’s trust account; the Company’s
ability to attract new and retain existing customers in a cost effective manner; competitive pressures in and any disruption to the industry in which the Company and its subsidiaries (the “Group”) operate; the Group’s ability to
achieve profitability despite a history of losses; and the Group’s ability to implement its growth strategies and manage its growth; the Group’s ability to meet consumer expectations; the success of the Group’s new product or service
offerings; the Group’s ability to attract traffic to its websites; the Group’s internal controls; fluctuations in foreign currency exchange rates; the Group’s ability to raise capital; media coverage of the Group; the Group’s
ability to obtain adequate insurance coverage; changes in the regulatory environments (such as anti-trust laws, foreign ownership restrictions and tax regimes) and general economic conditions in the countries in which the Group operates; the
Group’s ability to attract and retain management and skilled employees; the impact of the COVID-19 pandemic or any other pandemic on the business of the Group; the success of the Group’s strategic
investments and acquisitions, changes in the Group’s relationship with its current customers, suppliers and service providers; disruptions to the Group’s information technology systems and networks; the Group’s ability to grow and
protect its brand andthe Group’s reputation; the Group’s ability to protect its intellectual property; changes in regulation and other contingencies; the Group’s ability to achieve tax efficiencies of its corporate structure and
intercompany arrangements; potential and future litigation that the Group may be involved in; and unanticipated losses, write-downs or write-offs, restructuring and impairment or other charges, taxes or other liabilities that may be incurred or
required subsequent to, or in connection with, the consummation of the Business Combination and technological advancements in the Group’s industry. The foregoing list of factors is not exhaustive. You should carefully consider the foregoing
factors and the other risks and uncertainties described in the “Risk Factors” section of PubCo’sregistration statement on Form F-4 (the “ Registration Statement”), the proxy
statement/prospectus discussed below, Bridgetown’speriodic reports and other documents to be filed by PubCoor Bridgetown from time to time with the U.S. Securities and Exchange Commission (the “SEC”). These filings identify and
address other important risks and uncertainties that could cause actual events and results to differ materially from those contained in the forward-looking statements. In addition, there may be additional risks that neither Bridgetown nor the
Company presently knows, or that Bridgetown or the Company currently believes are immaterial, that could also cause actual results to differ from those contained in the forward-looking statements. Forward-looking statements reflect Bridgetown’s
and the Company’sexpectations, plans, projections or forecasts of future events and view. If any of the risks materialize or Bridgetown’s or the Company’s assumptions prove incorrect, actual results could differ materially from the
results implied by these forward-looking statements. Forward-looking statements speak only as of the date they are made. Bridgetown and the Company anticipate that subsequent eventsand developments may cause their assessments to change. However,
while PubCo, Bridgetown and the Company may elect to update these forward-looking statements at some point in the future, PubCo, Bridgetown and the Company specifically disclaim any obligation to do so, except as required by law. The inclusion of
any statement in this document does not constitute an admission by the Company nor Bridgetown or any other person that the eventsorcircumstances described in such statement are material. These forward-looking statements should not be relied upon as
representing Bridgetown’s or the Company’s assessments as of any date subsequent tothe date of this document. Accordingly, undue reliance should not be placed upon the forward-looking statements. In addition, the analyses of the Company
and Bridgetown contained herein are not, and do not purport to be, appraisals of the securities, assets or business of the Company, Bridgetown or any other entity.

Additional Information This communication relates to the proposed Business Combination between the Company and Bridgetown. This document
does not constitute an offer to sell or exchange, or the solicitation of an offer to buy or exchange, any securities, nor shall there be any sale of securities in any jurisdiction in which such offer, sale or exchange would be unlawful prior to
registration or qualification under the securities laws of any such jurisdiction. The proposed Business Combination will be submitted to shareholders of Bridgetown for their consideration. In connection with the Business Combination, PubCohas filed
the Registration Statement with the SEC, which was declared effective by the SEC on September 26, 2023 and includesaproxy statement of Bridgetown to be distributed to Bridgetown’s shareholders in connection with Bridgetown’s
solicitation for proxies for the vote by Bridgetown’s shareholders in connection with the proposed Business Combination and other matters as described in the Registration Statement (the “Proxy Statement”) and a prospectus relating to
the offer of the securities to be issued to the Company’s and Bridgetown’s shareholders in connection with the closing of the proposed Business Combination. Bridgetown and PubCoalso will file other documents regarding the proposed Business
Combination with the SEC. This communication is not a substitute for the Registration Statement, the Proxy Statement or any other document that Bridgetownwill send to its shareholders in connection with the Business Combination. Bridgetown’s
shareholders and other interested persons are advised to read the Proxy Statement, in connection with Bridgetown’s solicitation of proxies for its extraordinary general meeting of shareholders to be held to approve, among other things, the
proposed transactions, because these documents will contain important information about Bridgetown, PubCo, the Company and the proposed Business Combination. Shareholders and investors may also obtain a copy of the Proxy Statement, as well as other
documents filed with the SEC regarding the proposed transactions and other documents filedwith the SEC by Bridgetown, without charge, at the SEC’s website located at www.sec.gov or by directing a request to Bridgetown. The information contained
on, or that may be accessed through, the websites referenced in this document is not incorporated by reference into, and is not a part of, this document. Participants in the Solicitation Bridgetown, PubCoand the Company and certain of their
respective directors, executive officers and other members of management and employees may, under SEC rules, be deemed to be participants in the solicitations of proxies from Bridgetown’s shareholders in connection with the proposed
transactions. Information regarding the persons who may, underSEC rules, be deemed participants in the solicitation of Bridgetown’s shareholders in connection with the proposed transactions is set forth in the Proxy Statement. You can find more
information about Bridgetown’s directors andexecutive officers in Bridgetown’s annual report on Form 10-K for the fiscal year ended December 31, 2022filed with the SEC on March 30, 2023.
Additional information regarding the participants in the proxy solicitation and a description of their direct and indirect interests is included in the Proxy Statement. Shareholders, potential investors and other interested persons should read the
Proxy Statement carefully when it becomes available before making any voting or investment decisions. You may obtain free copies of these documents from the sources indicated above. No Offer or Solicitation This communication is for informational
purposes only and shall not constitute an offer to sell or the solicitation of an offer to buy any securities pursuant to the proposed Business Combination or otherwise, nor shall there be any sale of securities in any jurisdiction in which the
offer, solicitation or sale would be unlawful prior to the registration or qualification under the securities laws of any such jurisdiction. No offer of securities shall be made except by means of a prospectus meeting the requirements of
Section 10 of the Securities Act of 1933, as amended.

Thank you
Bridgetown (NASDAQ:BTWNU)
Historical Stock Chart
From Apr 2024 to May 2024

Bridgetown (NASDAQ:BTWNU)
Historical Stock Chart
From May 2023 to May 2024
